Download
1 / 58
650 likes | 871 Views
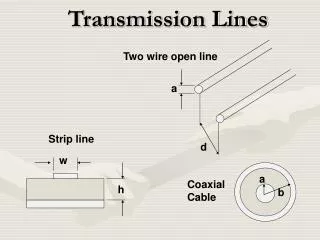
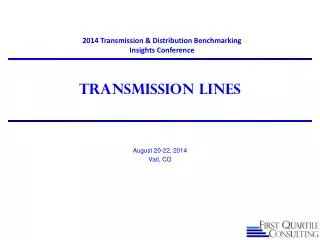
2014 Transmission & Distribution Benchmarking Data Review Conference. Transmission Lines. June 24-27 , 2014 Nashville, TN. Agenda. Picture source: www.energy.gov. Introduction Statistics and System Activity Financial Initiatives and Practices Next Steps.

E N D
2014 Transmission & Distribution Benchmarking Data Review Conference Transmission Lines June24-27, 2014 Nashville, TN
Agenda Picture source: www.energy.gov • Introduction • Statistics and System Activity • Financial • Initiatives and Practices • Next Steps
Key benchmarking Issues in Transmission Industry Methodology Regulatory • NERC regulations; other Regulatory bodies • NERC compliance audits • NERC performance standards (TADS) System Challenges • Distributed Generation • Interconnections (e.g. Windmill Farms) • Aging infrastructure • New transmission corridors • ROW management under increasing regulations and restrictions • Capacity Constraints • Transfer Capability Crisis (mitigated by the recession) • Intelligent Grid (or more intelligent Grid) • Upgrading EMS systems • Equipment lead times Organizational Challenges • Aging Workforce -- Brain Drain • Contractor Management • Cross-silo prioritization and involvement in projects • 2014: • Cyber security • FERC politicization • Transmission Systems are unique and designed to serve a particular geography, customer base, and other generation source and load constraints. • Costs are particularly uneven over time, so really need to be evaluated on a longer time horizon. • FERC capital additions do not reflect actual spending because of CWIP; Activity –based costs provide a more realistic spending level as well as the purpose of expenditures. • There is no agreement on cost normalization; asset base is the best predictor, but circuit miles, structure miles, MWh transmitted, MW-miles can be used to “triangulate” your performance. • Reliability is based primarily on “availability”, but also on contribution to ”End use” Customer reliability.
Statisticsand System Activity Landsnet – National Grid, Iceland
Transmission versus Distribution • For purposes of this survey, we define distribution to be a voltage level of 45kV and below. The distinction is somewhat arbitrary, but picks a point between 69kv which is generally considered a transmission (or at least sub-transmission) level and 21kV which would generally be considered distribution. • It is unrealistic to ask utilities to redefine their cost or reliability reporting on the basis of these definitions. However, a utility that has very different definitions may want to restate these statistics to better compare their performance. • Distribution Voltage Classes • 5kV class (>1kV, <=9kV) • 15kV class (>9kV, <=15kV) • 25kV class (>15kV to <=26kV) • 35kV class (>26kV to <=36kV) • 44kV class (>36kV to <=44kV) Transmission classes >=45kV • <69kV class (>=45kV <69kV) • 69kV class (>=69kV <100kV) • 100kV class (>=100kV <200kV) • 200kV Class (>=200kV <300kV) • 300kV Class (>=300 kV <400 kV) • 400kV and above
Transmission Lines Demographic Profile Contracting of what? We have numbers for every category. Add % contracting; % new lines These were removed at the leaders conference ADD Financial Demographics: depreciation, CWIP
TYPESOFTRANSMISSIONSTRUCTURESONSYSTEM Calculationused ST150.1/(ST150.1+ST150.2+ST150.3+ST150.4)*100 , ST150.2/(ST150.1+ST150.2+ST150.3+ST150.4)*100 , ST150.3/(ST150.1+ST150.2+ST150.3+ST150.4)*100 , ST150.4/(ST150.1+ST150.2+ST150.3+ST150.4)*100 ST p28
TRANSMISSIONVOLTAGESONSYSTEMBYOHCIRCUIT Calculationused ST120.3C/(ST120.1C+ST120.2C+ST120.3C+ST120.4C+ST120.5C+ST120.6C)*100,ST120.4C/( ST120.1C+ST120.2C +ST120.3C+ST120.4C+ST120.5C+ST120.6C)*100, ST120.5C/(ST120.1C+ST120.2C+ST120.3C+ST120.4C+ST120.5C+ST120.6C)*100,ST120.1C/( ST120.1C+ST120.2C +ST120.3C+ST120.4C+ST120.5C+ST120.6C)*100, ST120.2C/(ST120.1C+ST120.2C+ST120.3C+ST120.4C+ST120.5C+ST120.6C)*100,ST120.6C/( ST120.1C+ST120.2C +ST120.3C+ST120.4C+ST120.5C+ST120.6C)*100 ST p29
TRANSMISSIONCIRCUITMILEPERTRANSMISSIONCIRCUIT Calculationused (ST120|5_TransOH&UGCircMilev.13)/(ST120.1C+ST120.2C+ST120.3C+ST120.4C+ST120.5C+ST120.6C) ST p30
OHTRANSMISSIONSTRUCTUREMILEPEROHTRANSMISSIONCIRCUIT #35 and #40 show too little structure miles Calculationused (ST120.1A+ST120.2A+ST120.3A+ST120.4A+ST120.5A+ST120.6A)/(ST120.1C+ST120.2C+ST120.3C+ST120.4C+ST120.5C+ST120.6C) ST p31
TRANSMISSIONCIRCUITMILESPERTRANSMISSIONSTRUCTUREMILES Change to Ratio not % #35 should be close to 1.0; Calculationused (ST120|5_TransOH&UGCircMilev.13)/(ST120|5_OH&UGStructure miles)*100 ST p32
ANALYSIS:T&DPLANTINSERVICEPERDISTRIBUTIONEND-USECUSTOMER[FERC]ANALYSIS:T&DPLANTINSERVICEPERDISTRIBUTIONEND-USECUSTOMER[FERC] Calculationused (DF70.1)/(ST5_T&DDistEndUseCustomers) ,(DF70.2+ TF65.2)/(ST5_T&DDistEndUseCustomers) ,TF65.1/(ST5_T&D DistEndUseCustomers) ST p33
ANALYSIS:TRANSMISSIONLINESPLANTINSERVICEPERTRANSMISSIONCIRCUITMILEANALYSIS:TRANSMISSIONLINESPLANTINSERVICEPERTRANSMISSIONCIRCUITMILE Calculationused TF65.1/(ST120_TransCircMile09) ST p39
NEWTRANSMISSIONCIRCUITMILES Calculationused SA40.1/(ST120_TransCircMile09)*100 SA p26
TRANSMISSIONWOODSTRUCTURETEST/INSPECTION/TREATMENT/REPLACEMENTTRANSMISSIONWOODSTRUCTURETEST/INSPECTION/TREATMENT/REPLACEMENT #27 has very high % of wood structures replaced Calculationused SA65.1/ST150.1*100 ,SA65.2/ST150.1*100 ,SA65.3/ ST150.1*100 SA p29
Issues found: Transmission Line System Statistics and Activity
Financial – Overview of the Cost Model Working with an adjusted FERC model Conceptual transmission tower design by Choi Shine Architects
Trans Line Cost Profile Investigate why investment rate is high compared to last year
FERC: The ADJUSTED FERC COST MODEL FERC provides a general framework • Certain costs must be excluded to provide fair comparisons that focus on operations • Substation costs must be separated out, including certain allocations Substations
FERC: Specific Adjustments • The following page is a schematic of how basic FERC cost data will be adjusted for this benchmarking study. • A&G costs will be excluded – Utilities are asked to adjust their costs to exclude costs typically reported as A&G (e.g. pensions and benefits) from their O&M data. • General plant costs will be excluded – Utilities are asked to adjust their costs to exclude costs typically reported as General Plant (e.g. IT/Communications infrastructure) from their T&D Capital data. • Other T&D Capital exclusions: • Transmission: Land acquisitions and extraordinary items • Distribution: Land acquisitions, street lighting and extraordinary items • Other O&M exclusions: • Transmission: Wheeling, Rents/Leases, IT costs, extraordinary items. If you charge IT support to account 569, you should exclude it. Regional Market Expenses (Accts 575, 576). • Distribution: Streetlight Maintenance, Rents/Leases, IT costs, extraordinary items. If you charge IT support to Distribution O&M accounts, you should exclude it. • If you normally charge R&D, such as EPRI dues, to O&M, include it, unless it is an unusually large amount for this year • Substation costs will be allocated from Transmission and Distribution accounts, and similar adjustments made. • The goal of the exclusions is to provide a fairer comparison of T&D operational performance, by excluding certain costs that relate to demographic differences not under the control of T&D management.
TRANSMISSIONLINEO&M&CAPITALPERASSET[FERC] Calculationused (TF20_TransLinesO&MFERC)/TF65.1*100,(TF5_TransLinesCapitalFERC)/TF65.1*100 TF p2
TRANSMISSIONLINEO&M&CAPITALPERCIRCUITMILE[FERC][V.13] #40 does not show up on assets graph; Calculationused (TF20_TransLinesO&MFERC)/(ST120|5_TransOH&UGCircMile v.13),(TF5_TransLinesCapitalFERC)/(ST120|5_TransOH&UG CircMilev.13) TF p3
DV|%OFFERC-TRANSMISSIONLINECAPITAL #31 does not add to 100% • Very few adjustments to Capital Additions (FERC) beyond Substation allocations . . . Calculationused ( TF5.6 )/TF5.1*100,TF5.2/TF5.1*100,TF5.3/TF5.1*100 , TF5.4/TF5.1*100,TF5.5/TF5.1*100 TF p32
DV|%OFFERC-TRANSMISSIONLINESO&MEXPENSE Comments #31 does not at to 100%; all wheeling costs? • Very few adjustments beyond wheeling. Calculationused TF20.8/TF20.1*100,TF20.2/TF20.1*100,TF20.3/TF20.1*100 ,TF20.4/TF20.1*100 ,TF20.5/TF20.1*100 ,TF20.6/TF20.1 *100,TF20.7/TF20.1*100 TF p33
FINANCIALCOSTSADJUSTMENTS-TRANSMISSIONO&M Comments #31 does not at to 100%; all wheeling costs? Calculationused TF20.8/TF20.1*100,TF20.2/TF20.1*100,(TF20.3+TF20.4+TF20.5+TF20.6+TF20.7 )/TF20.1*100 TF p34
Financial – Overview of the activity-based Cost Model Photo source: Scientific American
A Process Model for Managing the Network Respond to Emergencies Add New Customers Sustain Network Expand Network Operate Network Project/Portfolio Management Develop and Approve Asset Plans Develop Network Strategy
ACTIVITY-BASED Cost Model • While FERC has the benefit of being a uniform system of accounts, there are several important shortcomings: • FERC capital spending lags behind actual spending; costs for large projects go into a Construction Work in Progress (CWIP) account and are not transferred until the assets are placed into service, sometimes a several year lag. • FERC capital accounts generally follow plant accounts and units of property (e.g. poles, towers, and fixtures) – not the typical reasons why utilities spend (e.g. new business) • FERC O&M accounts tend to be more activity-oriented, but do not necessarily track important categories (e.g. vegetation management) • For those reasons, a simplified Activity-Based Costing system was developed to get current year spending by activity. The following diagram depicts the Activity-Based approach
2014 Data Collection Guide Activity-Based Cost Model • Transmission Line Capital • Serve New • Expand • Sustain • Other • CIAC • T&D Substation Capital • Serve New • Expand • Sustain • Other • CIAC • Distribution Line Capital • Serve New • Expand • Sustain • Other • CIAC • Transmission Line O&M • Sustain the Network • Operate the Network • T&D Substation O&M • Sustain the Network • Operate the Network • Other • Distribution Line O&M • Sustain • Other The activity-based cost model breaks the expenditures into capital and O&M, and then splits them into the activities shown on the process model introduced above. The following 3 pages provide more details of the individual activities for Transmission, Substations, and Distribution.
2014 Data Collection Guide Activity Based Costs – Transmission Lines • Transmission Line Capital • Serve New: Extension to new customers or utility substations [Industrial/Generation/Wholesale] • Expand: Capacity Additions (Adding additional lines to existing substations, increasing capacity of existing lines) • Sustain: Replace/Repair in kind • Sustain: system improvements (reliability/efficiency) • Sustain: Service Restoration • Sustain: Line Relocations • Sustain: Transmission Operations Center • Sustain: Asset Retirement Costs for Transmission Plant (FERC 359.1) • Other • CIAC • Transmission Line O&M • Inspection and Maintenance Expense (except 569.1-4) • ROW/Vegetation Management • Service Restoration • Transmission Operations Center • Engineering/Design O&M (including FERC 561.5-8) • Other While capital expenditures are split among several different processes from the overall process model, O&M expenses are almost entirely associated with sustaining the network.
Transmission Line Capital spending (Activity-based) on sustain is decreasing Update for 2014 The “replacement” rate can be estimated by successively subtracting activities, such as serve new, capacity adds, line relocations, and storm restoration.
TRANSMISSIONLINECAPITALSPENDINGPERASSET[ACTIVITY-BASED][V.14]TRANSMISSIONLINECAPITALSPENDINGPERASSET[ACTIVITY-BASED][V.14] Calculationused TF45.1/TF65.1*100,TF45.2/TF65.1*100,TF45.3/TF65.1*100 ,TF45.1/TF65.1*100 ,TF45.4/TF65.1*100 ,TF45.5/TF65.1 *100,TF45.6/TF65.1*100 ,TF45.1/TF65.1,TF45.7/TF65.1*100 TF p11
TRANSMISSIONLINECAPITALSPENDING SUSTAIN - EXSERVENEW,EXPANDPERASSET[ACTIVITY-BASED][V.14] Comments • #31 has very high TOC capital activity cost • See change in title to refer to “Sustain” Calculationused TF45.1/TF45.1/1000000 ,TF45.2/TF45.2/1000000 ,TF45.3/ TF65.1*100 ,TF45.1/TF65.1*100 ,TF45.4/TF65.1*100 , TF45.5/TF65.1*100,TF45.6/TF65.1*100,TF45.1/TF65.1 , TF45.7/TF65.1*100 TF p13
OTHERACTIVITYBASEDCOSTS:TRANSMISSIONLINECAPITALSPENDING Calculationused TF46.1
TRANSMISSIONLINEO&MEXPENSEPERASSETS[ACTIVITY-BASED][V.14] Comments • #23, 32, 35 don’t show TOC • Why isn’t #40 on this chart?? But on the next? Calculationused TF55.1/TF65.1*100,TF55.1/TF65.1*100,TF55.2/TF65.1*100 ,TF55.4/TF65.1*100 ,TF55.5/TF65.1*100 ,TF55.1/TF65.1 *100,TF55.6/TF65.1*100 TF p17
TRANSMISSIONLINEO&MEXPENSEEXOPSCTRPERASSETS[ACTIVITY-BASED][V.14]TRANSMISSIONLINEO&MEXPENSEEXOPSCTRPERASSETS[ACTIVITY-BASED][V.14] Comments #27; 35 no inspection costs #35 no ROW #40 Why zero? on this chart but not the previous? Calculationused TF55.1/TF65.1*100,TF55.1/TF65.1*100,TF55.2/TF65.1*100 ,TF55.4/TF65.1*100 ,TF55.5/TF55.5/1000000 ,TF55.1/ TF65.1*100 ,TF55.6/TF65.1*100 TF p18
OTHERACTIVITYBASEDCOSTS:TRANSMISSIONLINEO&M Comments Calculationused TF56.1 TF p23
CWIPASA%OFCAPITALEXPENDITURES-TRANSMISSIONLINE Comments #32 very low CWIP #28 very high CWIP Show as a ratio Calculationused TF80.1/TF5.6*100 TF p24
ANALYSIS:SUBSTATIONALLOCATIONS-TRANSMISSIONCAPITALSPENDING MeanQuartile Mean 47% Comments This graph shows the percent of total FERC Capital Additions that have been allocated to Substations. Calculationused TF5.2 /TF5.1*100 TF 25
ANALYSIS:SUBSTATIONALLOCATIONS-TRANSMISSIONO&MSPENDING MeanQuartile Mean 9% Comments This graph shows the percent of total FERCO&M Expenses that have been allocated to Substations. Calculationused TF20.2/TF20.1*100 TF p26
Vegetation Management Expense/Acre Trimmed (TF 29) Expense/Miles Managed (TF p27) Expense/Acre Managed (TF p28) 10x Q2 2012 (N=5) Expense/Mile Trimmed (TF p30) 5x
FERCVSACTIVITYSPENDING:TRANSMISSIONLINECAPITALPERASSET[V.14] Comments #31 did not provide FERC capital #28 Activity capital is much higher than FERC Calculationused TF5.6 /TF65.1*100,(TF45_TransLineCapABCv.14)/TF65.1*100 TF p36
FERCVSACTIVITYSPENDING:TRANSMISSIONLINEO&MPERASSET[V.14] Comments #31 did not report FERC #33,35 FERC O&M is greater than Activity; should be the same. Calculationused TF20.8/TF65.1*100,(TF55_ABCTransLineO&Mv.14)/TF65.1*100 TF p37
A Process Model for Managing the Network Respond to Emergencies Add New Customers Sustain Network Expand Network Operate Network Project/Portfolio Management Develop and Approve Asset Plans Develop Network Strategy
Transmission Line Practices/initiatives 2014 Sections (by process) • Strategy (including Transmission Automation, and NERC standards) • Asset Management • Transmission Operations Center (TOC) • Maintenance (including ROW) • Planning/Engineering/Design • T-line Field Construction Activities (including WMS and Contractor Productivity • 2013 Sections • Asset Management -- Role of Asset Management, replacement programs, and problematic equipment • Planning/Engineering/Design –Improvement initiatives and changes to standards • T-line Field Activities – Initiatives underway and maintenance approaches • Work management systems – WMS Vendor and efforts to improve usefulness • Contractor Productivity – Challenges, measures and initiatives • Transmission Operations Center (TOC) – Changes and challenges. • Right of Way –Growth inhibitors, ROW uses, challenges and practices. • Transmission Automation – Technology initiatives underway • NERC Standards – Impact of NERC standards on transmission organizations, especially Critical Infrastructure Protection (CIP), Protection and Control (PRC), and Facilities Design (FAC). • Maintenance – Inspections, impact of deferred maintenance, initiatives to reduce outages
Transmission Practice Questions 2014 Sections (by process) • Strategy (including Transmission Automation, and NERC standards) • Asset Management • Transmission Operations Center (TOC) • Maintenance (including ROW) • Planning/Engineering/Design • T-line Field Construction Activities (including WMS and Contractor Productivity • Strategy - Transmission Automation • Top 5 technologies being deployed for Transmission Automation • Other transmission automation technologies • Asset Management • Predicting condition of various critical components • Role of the Asset Management organization in your decision -making • Key responsibilities of the Transmission Asset Management organization • What keeps you up at night worrying about your system • Infrastructure replacement programs underway • Classes of equipment that are becoming problematic: Transmission • Initiatives undertaken to improve getting a job from planning to delivery • Practices around permits and certifications that make planning effective • Transmission line standard changed recently and why • Measure used to track the success of engineering/design function • Transmission Operations Center • Transmission energy control centers • Changes in energy control centers in the last few years • Major challenges facing the energy control center • Initiatives that have been successful in improving the energy control function • Response to External Forces • Changes being made to energy management system (benefits or challenges)
Transmission Practice Questions (cont) 2014 Sections (by process) • Strategy (including Transmission Automation, and NERC standards) • Asset Management • Transmission Operations Center (TOC) • Maintenance (including ROW) • Planning/Engineering/Design • T-line Field Construction Activities (including WMS and Contractor Productivity • NERC Compliance • Impact of CIP5 and the change from requirements to results-based regulation • Handling and structuring audits • Separate NERC audits for Critical Infrastructure and Reliability Standards • People fully-dedicated to the NERC compliance organization • Process changes implemented for Critical Infrastructure Protection [CIP] • Organization and staffing levels for Critical Infrastructure Protection [CIP] • Process changes implemented for Protection and Control [PRC] • Organization and staffing levels for Protection and Control [PRC] • Process changes for Facilities Design, Connections, and Maintenance [FAC] • Positions added for compliance with [FAC] • Future changes coming that will impact on transmission organization
Transmission Practice Questions (cont) 2014 Sections (by process) • Strategy (including Transmission Automation, and NERC standards) • Asset Management • Transmission Operations Center (TOC) • Maintenance (including ROW) • Planning/Engineering/Design • T-line Field Construction Activities (including WMS and Contractor Productivity • Maintenance- ROW • Technologies/tools/practices that have improved ROW management: Chemical growth inhibitors; Herbicides; Other • Use of ROW land • Major challenges - near and long term - being faced by ROW management • Initiatives successful in improving ROW management operations • Initiatives successful in improving ROW contract management • Field Construction • Number of reporting locations transmission line field personnel work out of • Most important initiative underway to improve • Transmission line construction • Transmission line maintenance practices • Transmission line reliability • Important initiative underway to improve Transmission line reliability: Poles/Towers; Cable; Insulators; Other • WMS vendor and year of implementation or last major upgrade • Challenges seen in managing a contract workforce: Transmission • Productivity measures in place for contract crews • Practices that have been successful for improving contractor management • Transmission Maintenance • Regulatory drivers for Transmission Line inspection and maintenance • Regular inspections performed • Inspections added in the last year