Download
1 / 38
380 likes | 562 Views
ARD, Carderock Division, Bayview,ID Project Professors: Dr. Herb Hess & Dr. Brian Johnson. Data Acquisition and Data Management System For AESD. Jarred Coulter Vishu Gupta Zane Sapp. Final Design Review December 5, 2008. Overview. Project introduction DAQ Hardware Sensors Software

E N D
ARD, Carderock Division, Bayview,ID Project Professors: Dr. Herb Hess & Dr. Brian Johnson Data Acquisition and Data Management System For AESD Jarred Coulter Vishu Gupta Zane Sapp Final Design ReviewDecember 5, 2008
Overview • Project introduction • DAQ Hardware • Sensors • Software • Testing/Calculations • Recommended System • Future Work/Conclusions
Background • The Acoustic Research Detachment (ARD) of the Naval Surface Warfare Center, Carderock Division (NSWCCD) is located at Bayview, ID. • The Advanced Electric Ship Demonstrator (AESD) is a ¼ scale destroyer used to monitor acoustics and test electric propulsion technologies. AESD
Project Goals • Design a Data Acquisition System (DAQ) to interface with the existing systems on the AESD to: • Manage and display battery data from the propulsion and UPS systems • Data for voltages, currents, and temperatures • Correlate above data with the GPS data available • Graphical display • On board data storage buffer • Expandable Architecture
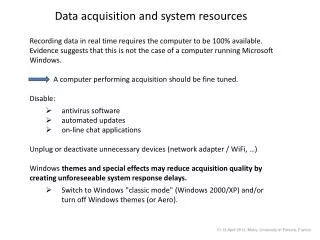
Design specifications • Ungrounded system • 120 V AC 25Amps available • Maximum 12 hours of data storage • System needs to be space efficient/ rack mountable • Expandable Architecture • Integrate with existing sensors and GPS already in place on the AESD
NI DAQ Lab Hardware System Components Data Acquisition System From National Instruments • PXI/SCXI Combination Chassis (1) • MXI Express Link (2) • M-Series DAQ and PXI/SCXI Chassis Controller (3) • 32-Channel Input Module/Multiplexer (4) • I/O Connector M-Series DAQ (Not Shown) (5) • Cast Screw Terminal Block for SCXI-1104C with Cold Junction Compensation (6)
NI Hardware Features • M-Series Data Acquisition Device • 333 ks/s • Up to 280 channels per DAQ device • 16-Bit ADC resolution • MXI-Express Connection • Bandwidth: 110 Mb/s and up to 250 Mb/s • PC and laptop compatible • High bandwidth allows for large channel count through multiple chassis • SCXI/PXI • Varietyof Input Modules for wide range of applications • Rugged chassis for industrial applications
LabVIEW 8.2 • Built in Virtual Instruments (VI) for data acquisition, analysis, storage and display • Mathscript capabilities • Stores all data in an ASCII text file called LabVIEW Measurement File (LVM) • DAQmx and DAQ Assistant for easier programming
Sensors Overview • LEM Current Transducers • Accurately measure wide range of currents • Cost ≈ $400 per unit • Hall Effect Voltage Transducers • Capable of accurately handling very high voltages • Cost ≈ $250 per unit • Isolation Amplifier Type Voltage Transducers • Designed • Cost ≈ $5 per unit • K-type Thermocouple Temperature Sensors • Wide measurement range • Cost ≈ $1.00 per ft
LEM Current Transducer LEM DC-C10 Features • DC Current Transducer • 3 Jumper Adjustable Ranges: 5, 10, 20 Amp Max • Supply Voltage: 20-50 VDC • ±1% Accuracy at 25 ̊C
ABB Voltage Sensor LEM CV 3-500 Features • Closed Loop Hall Effect Voltage Transducer • Measuring Range: 0 to 500 V • Output Voltage: 0 to 10 V (Max) • Supply Voltage: ± 15 VDC • ± 0.2% Accuracy at 25 ̊C
Designed Sensors • Designed Voltage Sensors • Low power consumption • Only one voltage reference or ground reference • Simple design • Linear input to output Voltage Sensor Schematic
Voltage Sensor Results Horz = 12V Vert = 12V Experimental Results Simulation Results
Temperature Sensors • K-type thermocouples used • Temperature range: -452.2˚F to 1562˚F • SCXI Modules designed for Thermocouple inputs with integrated Cold Junction Compensation ICs • Cost is approximately $1.00/ft for shielded thermocouple wire
LabVIEW Control for the DAQ • Program provides for: • Easy control for data acquisition • Real-time data display • Save the data to a file in a specified location • File can be opened with different analysis tools • User comments can also be added to the file. • Saved data is time and location stamped • Errors observed on system are saved as a text file- ‘Error Log’
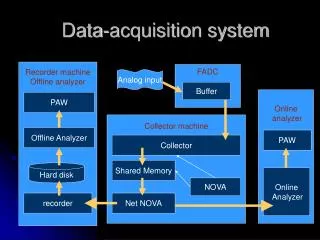
Flow diagram of the code • Check for valid GPS signal • Acquire data • Display Voltage and Current data as graphs • Numerical display for temperature • Save data to file • Check for stop condition
Front panel: Control/Indicator tab • Designed for the user to control the System and test • Divided into different tabs on the screen • Instructions • Control/Indicator • System error • Voltage graphs • Current graph • Temperature readings • GPS Front Panel: Control Front Panel: Control
Lab Setup Thermocouples ABB Voltage Sensor GPS Current LEM Designed sensors NI DAQ Battery Bank
Testing • Tests run on the system • Period: 2 hours • Measured • Battery Voltage (V) • String Current (A) • Battery temperature (°F) • Measurements taken on 9 channels • Current LEM • ABB Voltage Sensor • Opto-coupler sensors : 3 • Thermocouples : 4 • Error observed: None
Calculations • LATENCY • 1 sec with the GPS running. • <100ms without GPS • Dependant on sampling frequency • POWER CONSUMPTION • Lab Model: 510 Watts • Including PC power consumption of 60Watts
Recommended System: Calculations • The cost analysis for a full system with all the required hardware and software was done • Complete system includes: • Data Acquisition Cards • PC Controller and External Hard Drive • Thermocouple/Voltage Input Modules • Multi Chassis Adapter • MXI Express Connector • PXI and SCXI Chassis • LabVIEW • COST ANALYSIS • Total system cost: $140, 427.75 • Cost per channel: $87.17 • $68 per channel for additional channels • POWER CONSUMPTION • 1350 Watts • Note: detailed cost analysis is provided in the final report. Also given at the end of the presentation
Future Work • Integrate control of the sensors onto a Printed Circuit Board (PCB). • Feedback from the ARD for actual integration with the GPS system on-board the AESD. • Type of communication • Data format • Thermocouple Cards should be integrated into the lab model • Integrating real-time system with charging schemes of the propulsion batteries • Expanding LabVIEW • Event triggering/alarms on the monitored channels • For the recommended system • Post processing
Conclusions • System Capabilities: • Monitoring propulsion batteries and UPS batteries • Acquiring GPS data • Data and Error Log saved as text files • Sensors • Voltage • Current • Temperature • LabVIEW • Control the DAQ • Monitor the system
Acknowledgements University of Idaho Dr. Brian K. Johnson Dr. Herb Hess Dr. Chris Wagner Arleen Furedy Karen Cassil Beth Cree DorotaWilk ARD Alan Griffitts Frank Jurenka Karl Sette Research Group Justin Schlee John Finley Leo Luckose James Randall
Temperature sensors: Amplifier • Amplifier adds a gain of 924.3 • This is then scaled in LabVIEW • Explained later on in the presentation Amplified Thermocouple Voltage Thermocouple measurement Batteries Amplifier LabVIEW (scale down) DAQ
Temperature data • Modify amplified signal to obtain temperature readings. • The amplified signal is scaled down by the gain factor • Built in VI for converting voltage to temperature • Outputs the temperature • The units can be changed Amplified signal from SCXI 1104-C Output temperature on thermocouple 1 Built –in VI for converting Voltage to temperature
Detailed cost analysis sheet of the system used • Put in the cost sheet that we had for the system we are using right now.