Download
1 / 1

E N D
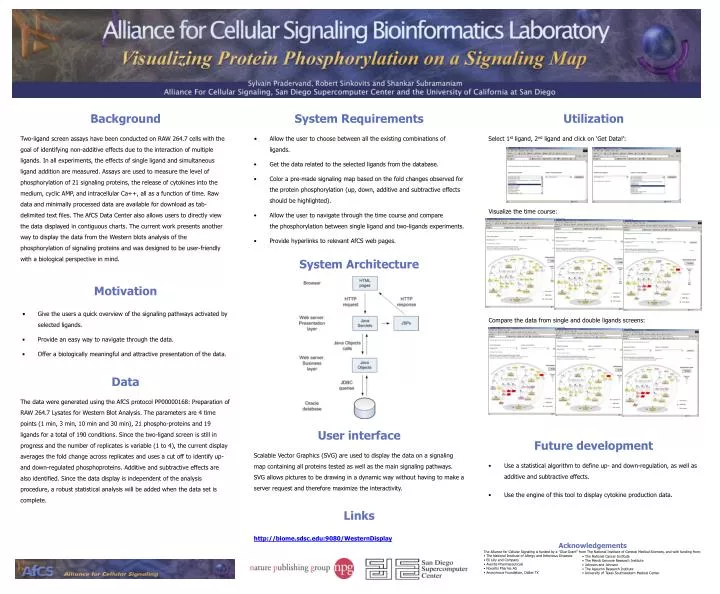
Background Two-ligand screen assays have been conducted on RAW 264.7 cells with the goal of identifying non-additive effects due to the interaction of multiple ligands. In all experiments, the effects of single ligand and simultaneous ligand addition are measured. Assays are used to measure the level of phosphorylation of 21 signaling proteins, the release of cytokines into the medium, cyclic AMP, and intracellular Ca++, all as a function of time. Raw data and minimally processed data are available for download as tab-delimited text files. The AfCS Data Center also allows users to directly view the data displayed in contiguous charts. The current work presents another way to display the data from the Western blots analysis of the phosphorylation of signaling proteins and was designed to be user-friendly with a biological perspective in mind. • System Requirements • Allow the user to choose between all the existing combinations of ligands. • Get the data related to the selected ligands from the database. • Color a pre-made signaling map based on the fold changes observed for the protein phosphorylation (up, down, additive and subtractive effects should be highlighted). • Allow the user to navigate through the time course and compare the phosphorylation between single ligand and two-ligands experiments. • Provide hyperlinks to relevant AfCS web pages. Utilization Select 1st ligand, 2nd ligand and click on ‘Get Data!’: Visualize the time course: System Architecture • Motivation • Give the users a quick overview of the signaling pathways activated by selected ligands. • Provide an easy way to navigate through the data. • Offer a biologically meaningful and attractive presentation of the data. Compare the data from single and double ligands screens: Data The data were generated using the AfCS protocol PP00000168: Preparation of RAW 264.7 Lysates for Western Blot Analysis. The parameters are 4 time points (1 min, 3 min, 10 min and 30 min), 21 phospho-proteins and 19 ligands for a total of 190 conditions. Since the two-ligand screen is still in progress and the number of replicates is variable (1 to 4), the current display averages the fold change across replicates and uses a cut off to identify up- and down-regulated phosphoproteins. Additive and subtractive effects are also identified. Since the data display is independent of the analysis procedure, a robust statistical analysis will be added when the data set is complete. User interface Scalable Vector Graphics (SVG) are used to display the data on a signaling map containing all proteins tested as well as the main signaling pathways. SVG allows pictures to be drawing in a dynamic way without having to make a server request and therefore maximize the interactivity. • Future development • Use a statistical algorithm to define up- and down-regulation, as well as additive and subtractive effects. • Use the engine of this tool to display cytokine production data. Links http://biome.sdsc.edu:9080/WesternDisplay • Acknowledgements • The Alliance for Cellular Signaling is funded by a "Glue Grant" from The National Institute of General Medical Sciences, and with funding from: • The National Institute of Allergy and Infectious Diseases • Eli Lilly and Company • Aventis Pharmaceuticals • Novartis Pharma AG • Anonymous Foundation, Dallas TX • The National Cancer Institute • The Merck Genome Research Institute • Johnson and Johnson • The Agouron Research Institute • University of Texas Southwestern Medical Center