Download
1 / 2
20 likes | 105 Views
Example: The following data give the total number of iPods sold by a mail order company on each of 30 days. 25 11 15 29 22 10 5 17 21 13 26 16 18 12 9 26 20 16

E N D
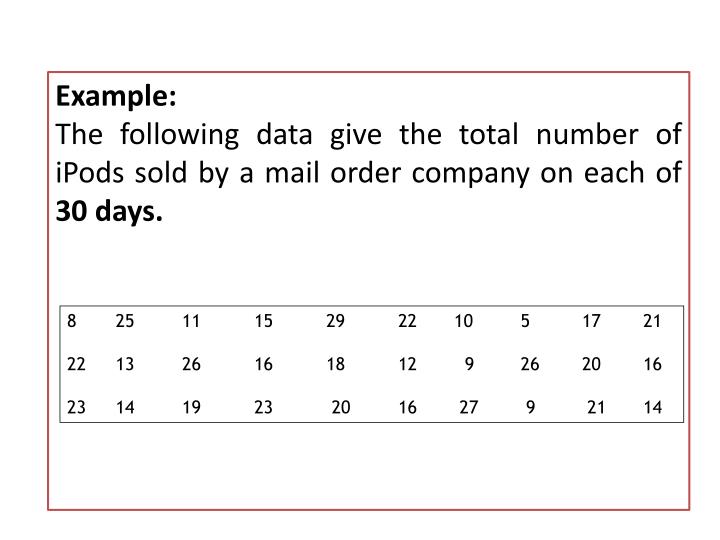
Example: The following data give the total number of iPods sold by a mail order company on each of 30 days. • 25 11 15 29 22 10 5 17 21 • 13 26 16 18 12 9 26 20 16 • 23 14 19 23 20 16 27 9 21 14
Questions • Ungrouped data • Find mean, median, mode, range, variance and standard deviation • Grouped data • Construct frequency table (Hint: 5 number classes). • Draw a histogram • Find mean, median, mode, range, variance and standard deviation