Download

1 / 108
1.1k likes | 1.28k Views
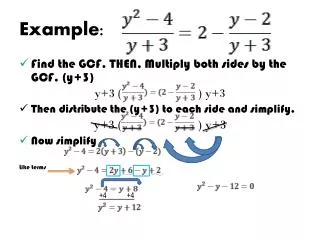
Example. Freshman, Sophomore, Junior, Senior Measure Happiness (1-100). ANOVA. Traditional F test just tells you not all the means are equal Does not tell you which means are different from other means. Why not. Do t-tests for all pairs Fresh vs. Sophomore Fresh vs. Junior

E N D
Example • Freshman, Sophomore, Junior, Senior • Measure Happiness (1-100)
ANOVA • Traditional F test just tells you not all the means are equal • Does not tell you which means are different from other means
Why not • Do t-tests for all pairs • Fresh vs. Sophomore • Fresh vs. Junior • Fresh vs. Senior • Sophomore vs. Junior • Sophomore vs. Senior • Junior vs. Senior
Problem • What if there were more than four groups? • Probability of a Type 1 error increases. • Maximum value = comparisons (.05) • 6 (.05) = .30
Chapter 12 • A Priori and Post Hoc Comparisons • Multiple t-tests • Linear Contrasts • Orthogonal Contrasts • Trend Analysis • Bonferroni t • Fisher Least Significance Difference • Studentized Range Statistic • Dunnett’s Test
Multiple t-tests • Good if you have just a couple of planned comparisons • Do a normal t-test, but use the other groups to help estimate your error term • Helps increase you df
Proof Candy Gender 5.00 1.00 4.00 1.00 7.00 1.00 6.00 1.00 4.00 1.00 5.00 1.00 1.00 2.00 2.00 2.00 3.00 2.00 4.00 2.00 3.00 2.00 2.00 2.00
Within Variability • Within variability of all the groups represents “error” • You can therefore get a better estimate of error by using all of the groups in your ANOVA when computing a t-value
Hyp 1: Juniors and Seniors will have different levels of happiness Hyp 2: Seniors and Freshman will have different levels of happiness
Hyp 1: Juniors and Seniors will have different levels of happiness
Hyp 1: Juniors and Seniors will have different levels of happiness
Hyp 1: Juniors and Seniors will have different levels of happiness
Hyp 1: Juniors and Seniors will have different levels of happiness t crit (20 df) = 2.086
Hyp 1: Juniors and Seniors will have different levels of happiness t crit (20 df) = 2.086 Juniors and seniors do have significantly different levels of happiness
Hyp 2: Seniors and Freshman will have different levels of happiness
Hyp 2: Seniors and Freshman will have different levels of happiness
Hyp 2: Seniors and Freshman will have different levels of happiness
Hyp 2: Seniors and Freshman will have different levels of happiness t crit (20 df) = 2.086
Hyp 2: Seniors and Freshman will have different levels of happiness t crit (20 df) = 2.086 Freshman and seniors do not have significantly different levels of happiness
Hyp 1: Juniors and Sophomores will have different levels of happiness Hyp 2: Seniors and Sophomores will have different levels of happiness PRACTICE!
Chapter 12 • A Priori and Post Hoc Comparisons • Multiple t-tests • Linear Contrasts • Orthogonal Contrasts • Trend Analysis • Bonferroni t • Fisher Least Significance Difference • Studentized Range Statistic • Dunnett’s Test
Linear Contrasts • You think that Freshman and Seniors will have different levels of happiness than Sophomores and Juniors
Linear Contrasts • Allows for the comparison of one group or set of groups with another group or set of groups
Linear Contrasts a = weight given to a group
Linear Contrasts 1 2 3 4 a1 = 0, a2 = 0, a3 = 1, a4 = -1 L = -23 a1 = 1, a2 = 0, a3 = 0, a4 = -1 L = -9 a1 = .5, a2 = -.5, a3 = -.5, a4 = .5 L = 80.5 – 67 = 13.5
SS Contrast • You can use the linear contrast to compute a SS contrast • SS contrast is like SS between • SS contrast has 1 df • SS contrast is like MS between
SS Contrasts a1 = .5, a2 = -.5, a3 = -.5, a4 = .5 L = 80.5 – 67 = 13.5
SS Contrasts a1 = .5, a2 = -.5, a3 = -.5, a4 = .5 L = 80.5 – 67 = 13.5 n = 6 L = 13.5 Sum a2 = .52+-.52+ -.52 + .52 = 1
SS Contrasts a1 = .5, a2 = -.5, a3 = -.5, a4 = .5 L = 80.5 – 67 = 13.5 n = 6 L = 13.5 Sum a2 = .52+-.52+ -.52 + .52 = 1
SS Contrasts a1 = 1, a2 = -1, a3 = -1, a4 = 1 L = 161 – 134 = 27
SS Contrasts a1 = 1, a2 = -1, a3 = -1, a4 = 1 L = 161 – 134 = 27 n = 6 L = 27 Sum a2 = 12+-12+ -12 + 12 = 4
SS Contrasts a1 = 1, a2 = -1, a3 = -1, a4 = 1 L = 161 – 134 = 27 n = 6 L = 27 Sum a2 = 12+-12+ -12 + 12 = 4
F Test Note: MS contrast = SS contrast
F Test Fresh & Senior vs. Sophomore & Junior
F Test Fresh & Senior vs. Sophomore & Junior
F Test Fresh & Senior vs. Sophomore & Junior F crit (1, 20) = 4.35