Download

1 / 18
180 likes | 385 Views
Surface Water Balance (2). Review of last lecture Components of global water cycle. Ocean water Land soil moisture, rivers, snow cover, ice sheet and glaciers Sea ice Atmosphere water vapor, clouds, precipitation Water in biosphere (including human beings). Surface water balance.

E N D
Review of last lectureComponents of global water cycle • Ocean water • Land soil moisture, rivers, snow cover, ice sheet and glaciers • Sea ice • Atmosphere water vapor, clouds, precipitation • Water in biosphere (including human beings)
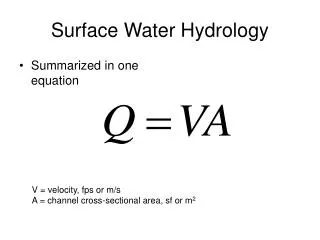
Surface water balance The changing rate of soil moisture S dS/dt = P - E - Rs - Rg + I Precipitation (P) Evaportranspiration (E) Irrigation (I) Runoff (Rs) dS/dt Infiltration (Rg)
Evaportranspiration • Is equivalent to latent heat flux • Has four components: E = Eb + Ei + Es + TR Evaporation from inception storage (Ei) Transpiration (TR) Evaporation from bare soil (Eb) Snow sublimation (Es)
Reference evaportranspiration • A large number of more or less empirical methods have been developed over the last 50 years by numerous scientists and specialists worldwide to estimate evapotranspiration from different climatic variables. Relationships were often subject to rigorous local calibrations and proved to have limited global validity. Testing the accuracy of the methods under a new set of conditions is laborious, time-consuming and costly, and yet evapotranspiration data are frequently needed at short notice for project planning or irrigation scheduling design. • To meet this need, the Food and Agriculture Organization (FAO) of the United Nations developed and published four methods for calculating a reference evaportranspiration: the Blaney-Criddle, radiation, modified Penman and pan evaporation methods.
Evaluation of the four methods • The Penman methods may require local calibration of the wind function to achieve satisfactory results. • The radiation methods show good results in humid climates where the aerodynamic term is relatively small, but performance in arid conditions is erratic and tends to underestimate evapotranspiration. • Temperature methods remain empirical and require local calibration in order to achieve satisfactory results. A possible exception is the 1985 Hargreaves' method which has shown reasonable ETo results with a global validity.
Evaluation of the four methods (cont) • Pan evapotranspiration methods clearly reflect the shortcomings of predicting crop evapotranspiration from open water evaporation. The methods are susceptible to the microclimatic conditions under which the pans are operating and the rigour of station maintenance. Their performance proves erratic. • The relatively accurate and consistent performance of the Penman-Monteith approach in both arid and humid climates has been indicated in many studies.
Penman-Monteith equation where Rn is the net radiation, G is the soil heat flux, (es - ea) represents the vapour pressure deficit of the air, ra is the mean air density at constant pressure, cp is the specific heat of the air, D represents the slope of the saturation vapour pressure temperature relationship, g is the psychrometric constant, and rs and ra are the (bulk) surface and aerodynamic resistances.
Soil moisture • Typically expressed as ‘volumetric soil water content’ S = Vwater / Vsoil • Increases with depth • Complicated to measure Root zone Intermediate zone Ground water
Palmer drought severity index (PDSI) • was developed by Wayne Palmer in the 1960s and uses temperature and rainfall information in a model to determine dryness of soil moisture. • is most effective in determining long term drought (a matter of several months) and is not as good with short-term forecasts (a matter of weeks). • It uses a 0 as normal, and drought is shown in terms of minus numbers; for example, minus 2 is moderate drought, minus 3 is severe drought, and minus 4 is extreme drought.
Desertification • Caused mainly be human activities and climate change • Is one of the most significant global environmental problems • About a billion people are under threat
Infiltration - Darcy’s law • The infiltration flux where • Y is wetting front soil suction head • h0 is the depth of ponded water above the ground surface • K is the hydraulic conductivity • L is the total depth of subsurface ground in question. Rg
Surface water balance The changing rate of soil moisture S dS/dt = P - E - Rs - Rg + I Evaportranspiration (E=Eb+Ei+Es+TR) Penman-Monteith eq Precipitation (P) Irrigation (I) Runoff (Rs) dS/dt (PDSI, desertification) Infiltration (Rg Darcy’s law)