Download
1 / 6
60 likes | 249 Views
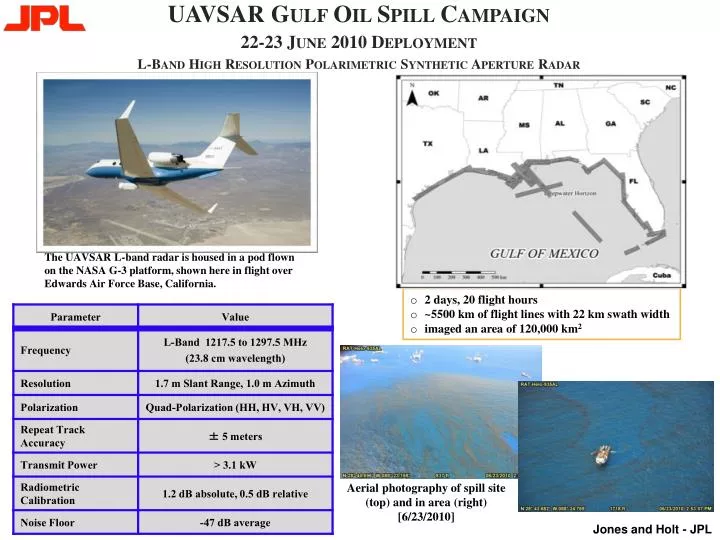
UAVSAR Gulf Oil Spill Campaign 22-23 June 2010 Deployment L-Band High Resolution Polarimetric Synthetic Aperture Radar. The UAVSAR L-band radar is housed in a pod flown on the NASA G-3 platform, shown here in flight over Edwards Air Force Base, California. 2 days, 20 flight hours

E N D
UAVSAR Gulf Oil Spill Campaign 22-23 June 2010 Deployment L-Band High Resolution Polarimetric Synthetic Aperture Radar The UAVSAR L-band radar is housed in a pod flown on the NASA G-3 platform, shown here in flight over Edwards Air Force Base, California. • 2 days, 20 flight hours • ~5500 km of flight lines with 22 km swath width • imaged an area of 120,000 km2 Aerial photography of spill site (top) and in area (right) [6/23/2010] Jones and Holt - JPL
UAVSAR Gulf Oil Spill Campaign Overview Science Goals Study Oil Spill Detection and the Impact of Oil Inundationin Wetland Ecosystems Using High Resolution Polarimetric L-band Radar • Develop and validate algorithms for improved discrimination of oil slicks on water and collect data that will enable us to better determine oil properties from polarimetric radar backscatter returns. • Study the use of radar for determining the extent of oil penetration into sensitive coastal ecological zones, in particular, to map the spread of oil from the coastline into coastal wetlands. • Use the radar data to determine the extent and nature of the damage to different coastal ecosystems and to track ecosystem recovery. • Combine optical and radar data for better detection and impact assessment (UAVSAR & AVIRIS). Jones and Holt - JPL
Science Goal I Oil Detection and Characterization B. Minchew, C. E. Jones, B. Holt (Caltech/JPL), “Polarimetric L-band SAR Signatures of Oil from the Deepwater Horizon Spill” submitted IEEE Trans. Geoscience and Remote Sensing, 2011. Averaged Intensity Images Polarimetric Returns vs. Incidence Angle 140° Heading 140° Heading 320° Heading •All polarization combinations (HH, VV, HV) (right panels) discriminate water and oil Clear Ocean scene overlap common point MAIN SLICK • Scattering properties dependent on HV polarization (right bottom panel) are more sensitive to oil–water separation and varying oil properties, compared to HH and VV polarizations. Oil 4 Oil 5 Oil 6 + rig site 5 km UAVSAR results indicate a method to discriminate varying oil properties under all-weather conditions. Jones and Holt - JPL
Science Goal II Mapping Oil Extent in Coastal Wetlands Elijah Ramsey, A. Rangoonwala, Y. Suzuoki (USGS, National Wetlands Research Center), C. E. Jones (Caltech/JPL), “Oil Detection in a Coastal Marsh with Polarimetric SAR”, manuscript in preparation. • Goal of Study: • Use full-polarization complex scattering matrix information to detect oil on waterways, and marsh vegetation, including sub-canopy oiling of vegetation stalks and soil. • Classification Methods Studied: • Entropy/Anisotropy/Alpha Polarimetric Decomposition (Cloude-Pottier [CP]) • Freeman-Durden Decomposition [FD] • Unsupervised Wishart Classification with CP or FD classes. Study area included 3 UAVSAR flight lines from June 2010 and one repeat line from June 2009. Underflight ground data provided by DHS & NASA/Stennis . Photos taken 6/23/2010, courtesy of Bruce Davis (DHS) Jones and Holt - JPL
Science Goal II Mapping Oil Extent in Coastal Wetlands Elijah Ramsey, A. Rangoonwala, Y. Suzuoki (USGS, National Wetlands Research Center), C. E. Jones (Caltech/JPL), “Oil Detection in a Coastal Marsh with Polarimetric SAR”, manuscript in preparation. Barataria Bay, Louisiana: Oiled vegetation along shoreline shows up brighter in the cross-polarization (HV) returns. Oil on water shows as dark areas in the radar image. POLSAR false color composite (HH=red, HV=green, VV=blue) Studies of this area show that UAVSAR can detect oil on vegetation in coastal marshlands. Jones and Holt - JPL
Application Monitoring Containment Booms for Rapid Response C. E. Jones (Caltech/JPL), B. A. Davis (DHS) “High Resolution Radar for Response and Recovery: Monitoring Containment Booms in Barataria Bay,” PE&RS, February 2011. UAVSAR, 1.7 m resolution (HH-red, HV=green) Jones and Holt - JPL