Download
1 / 15
150 likes | 275 Views
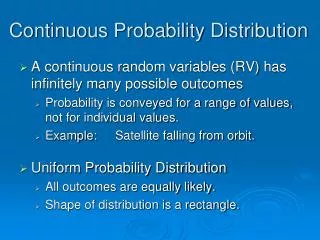
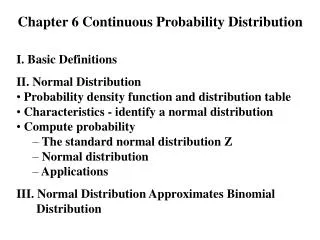
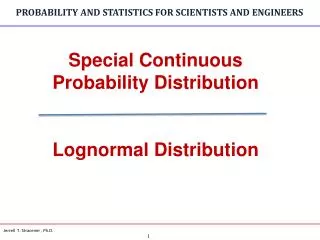
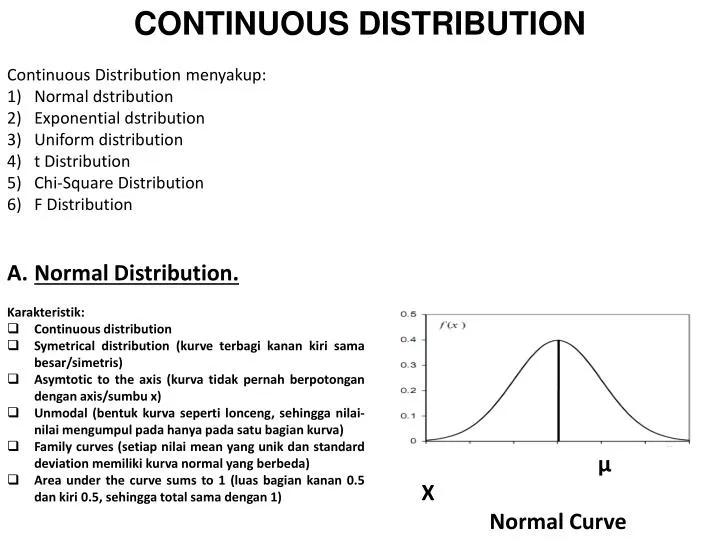
CONTINUOUS DISTRIBUTION. Continuous Distribution menyakup : Normal dstribution Exponential dstribution Uniform distribution t Distribution Chi-Square Distribution F Distribution Normal Distribution. µ X Normal Curve. Karakteristik :

E N D
CONTINUOUS DISTRIBUTION Continuous Distribution menyakup: Normal dstribution Exponential dstribution Uniform distribution t Distribution Chi-Square Distribution F Distribution Normal Distribution. µ X Normal Curve • Karakteristik: • Continuous distribution • Symetrical distribution (kurveterbagikanankirisamabesar/simetris) • Asymtotic to the axis (kurvatidakpernahberpotongandengan axis/sumbu x) • Unmodal (bentukkurvasepertilonceng, sehingganilai-nilaimengumpulpadahanyapadasatubagiankurva) • Family curves (setiapnilai mean yang unikdan standard deviation memilikikurva normal yang berbeda) • Area under the curve sums to 1 (luasbagiankanan 0.5 dankiri 0.5, sehingga total samadengan 1)
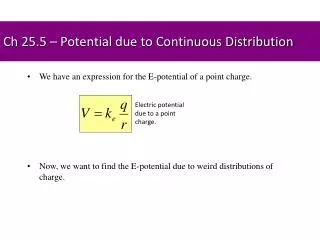
Probability Function of the Normal Distribution Normal distribution dicirikandengan 2 parameter yakni: µdanσ. Nilai parameter tersebutmenghasilkan normal distribution. Fungsi ND: Stadardized Normal Distribution. Setiappasangnilaiµdanσmemiliki ND yang berbeda. µ = Mean X σ = Standard Deviation of X σ2= Variance of X Π = 3.14 e = 2.718 σ=5 σ=5 σ=10 80 50
Formula untuksuatunilai X dengan ND: • X - µ • Z = ------------ • σ • Zscoreadalahangka standard deviation yang menunjukkannilai X dari mean. • JikaZsecorenegatif, makanilai X lebihkecildari mean • JikaZsecorepositif, makanilai X lebihbesardarimean • Formula itudapatdigunakanuntukmengonversijaraksuatunilai X dari mean denganukuran unit standard deviation. • Tabel standard Z digunakanuntukmenentukanprobabilitasmasalahkurva normal yang telahdikonversikedalamZscore. • Z Distribution adalah normal distribution dengan mean samadengan 0 dan standard deviation samadengan 1. • Contoh 1. • Nilai mean untuk GMAT adalah 485 dengan standard deviation adalah 105. Jikanilai GMAT berdstribusi normal, makaberapaprobabilitassuatunilaiantara 600 dan mean yang dipilihsecara random?. • P(485≤ X ≤ 600│µ=485 danσ=105)=…?
P(485≤ X ≤ 600│µ=485 danσ=105)=…? X - µ Z = ------------ σ 600-485 Z = ------------ = 1.10 105 Zscoreuntuk 1.10 menyatakanbahwa score GMAT sebesar 600 adalah 1.10 standard deviation lebihdari mean. Nilai 1.10 jikadlihatpadatabel Z Distribution sebagaberikut: TABEL Z DISTRIBUTION
P(485≤ X ≤ 600│µ=485 danσ=105)=…? Probablitasuntuk Z=1.10 adalah 0.3643 Bagian yang diarsirdarigambardikananmenunjukkanbahwanilaiprobabilitasmerupakanprobabilitasataudaerahantaranilai X dan mean µ=485 X=600 σ=105 Z=0 Z=1.10 µ=485 X=600 σ=105 Solusiterhadapnilai X 0.3643 0.3643 Solusiterhadapnilai X dengannilai Z
Contoh2. Berapaprobabilitasuntukmemperolehnilai GMAT lebihbesardari 700 dengan mean=485 dan standard deviation=105? P(X >600│µ=485 danσ=105)=…? X - µ Z = ------------ σ 700-485 Z = ------------ = 2.05 105 Nilai Z=2.05 jikadilihatpadatabel Z distribution menunjukkanZscore = 0.4798. X>700 µ=485 X=700 σ=105 µ=485 X=700 σ=105 Z=0 Z=2.05 0.5000 0.5000 Probablitasuntukmemperoleh score > 700 adalah =0.5000-0.4798 =0.0202 0.4798 0.4798