Download
1 / 30
300 likes | 499 Views
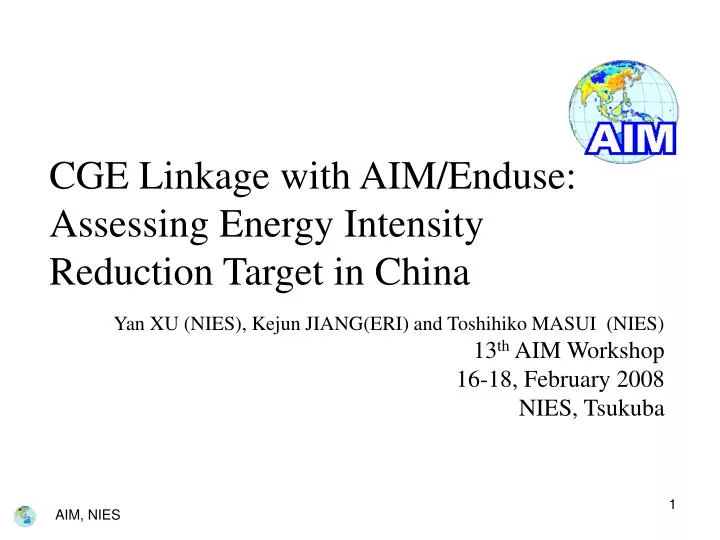
CGE Linkage with AIM/Enduse: Assessing Energy Intensity Reduction Target in China. Yan XU (NIES), Kejun JIANG(ERI) and Toshihiko MASUI (NIES) 13 th AIM Workshop 16-18, February 2008 NIES, Tsukuba. Contents. Background Why to Link Two Models? How to Link Two Models?

E N D
CGE Linkage with AIM/Enduse: Assessing Energy Intensity Reduction Target in China Yan XU (NIES), Kejun JIANG(ERI) and Toshihiko MASUI (NIES) 13th AIM Workshop 16-18, February 2008 NIES, Tsukuba
Contents • Background • Why to Link Two Models? • How to Link Two Models? • Preliminary Simulation Results • Further Work
Background • Energy consumption in China is large in volume and shows rapid growth in the past 20 years. • Therefore, in 11th Five-Year Plan (2006-2010) Chinese government set the target that energy consumption per GDP should be 20% decline in 2010 from the level of that at the end of 2005. • This experiment is to link Top-down model with Bottom-up model and analyze the possibility of the above target and propose policy suggestions. Fig 1: Energy consumption from 1978 to 2005
Why to Link Two Models (1)Bottom-up vs. Top-down • Two basic approaches to examine the linkages between the economy and energy system. • Conventional Bottom-up (BU) models: • describe current and prospective competition of energy technologies in detail, both on the supply-side (substitution possibility between primary energies) and on the demand-side (end-use energy efficiency and fuel substitution), e.g. MARKAL • Conventional top-down (TD) models: • dominated by Computable General Equilibrium (CGE) models since 1980’s, • represent real-world micro-economic responsiveness to policies, such as substitutability of energy for other inputs or consumption goods (Hourcade, 2006).
Why to Link Two Models (2)BU and TD Limitations • BU models do well in terms of technological explicitness, but less well in terms of macro-economic completeness and general micro-economic realism. • TD models do well in the latter terms, but they fail to represent detailed technology information and thus fail to represent the potential for no-regret options over the short run and substantially different technological futures over the long run. Fig. 2: Three-dimensional Assessment of Energy-Economy Models (Hourcade, 2006)
Why to Link Two Models (3) • In order to compensate for the limitations of one approach or the other, a number of researchers have tried to develop “hybrid” models. • The first example was reported by Hoffman and Jorgensen in 1977. They linked the Brookhaven energy system optimization model and an econometric model; • Since 1990’s, more teams are making efforts in building hybrid model
How to Link Two Models Methodology in Our Study
Common Scenario Assumption: • Economic growth; • Population; • International Fuel prices; • Environmental constraints Aggregating and Calculation Service Demand; Fuel price Sector output level; Energy price AIM/Enduse (Bottom-Up) AIM/CGE (Top-Down) Aggregating and Calculation Technology and fuel mix; Energy demand Cost; Annual Energy Efficiency Improvement; Additional investment
Advantages and Disadvantages • The advantages of this procedure are: • It is cost-effective to link existing well-documented and tested models than designing new models for the whole system or interconnection of systems; • it is more flexible, leaving the constituent model intact for independent runs, thus making further model development an easier work; • Comparing to hard-linking, it has the following Shortcomings: • Difficulties in uncertainty analysis • Problem of maintaining the quality of the soft-linking when it is transferred to other users • Soft-linking seems the most practical starting point for linking models.
AIM/CGE China Model Description (1)Static Part • Production & Consumption: Nested CES function • International Trade: • Small open economy assumption • Environment: CO2 & SO2 • 2002 Input-Output (IO) table • Historical data: 2003-2005; • Simulation period: 2006-2010; • 38 sectors, including 8 energy goods Coal, raw oil, natural gas, oil products, coke, electricity, heat, and coal gas • Software: GAMS/MPSGE
AIM/CGE China Model Description (2)Recursive Dynamic • Simulation is iterated year by year. The main driving forces of the economic growth are the labor force, capital accumulation, and technology change. • Total investment is decided from expected GDP growth rate in the next period, present capital stock, and technology change • The total investment is distributed into each sectors based on logit function taken into account profit from capital. • The capital stock in each sector is estimated from the investment. • (1) • (2) • (3)
AIM/CGE China Model Description (3)Scenarios • Scenarios • Other assumptions: • Labor supply; • Productivity change of labor; • Future international price; • Depreciation rate for capital stock: 5% • Change of preference in household sector • Energy efficiency improvement;
AIM/Enduse China Model • Energy end users are divided into five sectors: • the industrial, agricultural, services, residential and transport sectors. • Every sector is split into several sub-sectors, or products or services mode. Totally, there are about 60 sub-sectors and 160 kinds of service demands. • Different technologies related to the demand for services are collected for every sub-sector and product. • Technologies for services production • Technologies for energy recovery utilization • Technologies for energy conversion • More than 500 technologies have been collected for the analysis, which cover the major technologies used in every sector.
First Run of CGE (1) • Annual Energy Efficiency Improvement (AEEI): 2.5%; • Run CGE for the first time
First Run of CGE (2)Important Results for AIM/Enduse Note: Sector output level in 2005 =1;
Feedback from AIM/Enduse Based on energy demand from Enduse model and output level from CGE model ED2010, ED2005: Energy demand per unit output in the year of 2010 and 2005 respectively; j: sector
Second Run of CGE • Update assumption on AEEI • Run CGE for the second time
Comparison between First Run and Second Run Sector Output Level Second Run First Run Note: Sector output level in 2005 =1;
Comparison between First Run and Second RunEnergy Consumption Unit: Mtce Second Run First Run
Comparison between First Run and Second RunEnergy Intensity Second Run, EI reduction: 12.8% First Run, EI reduction: 9.1%
Feekback from Second Run of CGE to AIM/Enduse Note: Sector output level in 2005 =1;
Further Iteration • Second run AIM/Enduse • Update assumptions in CGE and run CGE for the third time, and so on • Until the differences between last run and present run are very small
Primary Findings Unit: tce/10000 RMB Yuan • Under the reference case, the 20% reduction target can’t be achieved. • It is necessary to take some policies to achieve that target. • Investment policies; • Subsidies • Energy efficiency standard • Energy tax
Further Work • Improve and complete the simulation for three scenarios under reference case • Introduce policy measures into the hybrid model • Investment policies; • Export tax • Energy tax/Environmental tax • Provide suggestions for next Five-year Plan
Thank you!Your comments are welcome! 81-29-850-2355 xu.yan@nies.go.jp http://www-iam.nies.go.jp/aim/
Production sector =0 Composite of intermediate goods Composite of energy and valued added =0 =0.5 Intermediate goods 1 Intermediate goods 22 Composite of energy goods Value added =1 =0.1 Capital Labor Composite of fossil fuel Non fossil fuels =0.5 =1 Non-coal fossil fuels Coal Electricity Heat =0.5 : Elasticity of substitution between different inputs Natural gas City gas Crude oil Coke Oil products Appendix: Nesting of the production structure in non-energy sector
Production sector =0 Composite of energy goods Value added Composite of intermediate goods =0 =1 =0 Fossil fuel Non fossil fuels Labor Capital Intermediate goods 1 Intermediate goods 22 : Elasticity of substitution between different inputs Nesting of the production structure in energy sector
Representative household σ=0.5 Non-energy final demand Energy final demand σ=1 σ=1 Energy commodity 1 Energy commodity 8 Non-energy commodity 1 Non-energy commodity 22 Nesting of the consumption structure
Domestic market Total domestic supply International market =4 Exports Domestic Imports T=4 Commodity 1 Commodity i International market T=0 Activity Production sector T: Elasticity of transformation : Elasticity of substitution Goods Market Relationship between domestic market and international market