Download
1 / 33
740 likes | 2.21k Views
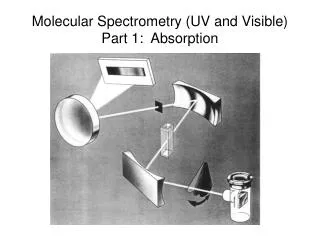
UV-visible molecular absorption spectroscopy. Chemistry 243. Transmission and absorbance and losses. The reduction in the intensity of light transmitted through a sample can be used to quantitate the amount of an unknown material. Beer’s Law.

E N D
UV-visible molecular absorption spectroscopy Chemistry 243
Transmission and absorbance and losses • The reduction in the intensity of light transmitted through a sample can be used to quantitate the amount of an unknown material.
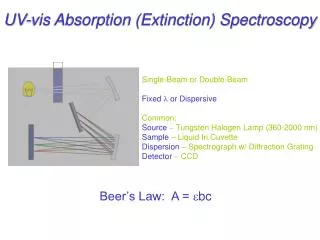
Beer’s Law • Quantitative relationship between absorbance and concentration of analyte • See derivation in text (Skoog: pages 337-338) • Absorption is additive for mixtures Really: Al = elbc Beer’s Law is always wavelength-specific
Limitations and deviations from Beer’s Law • Real limitations • Non-linearities due to intermolecular interactions • Self aggregation effects and electrolyte effects • Apparent • Dynamic dissociation or association of analyte • Instrumental • Polychromatic radiation • Different molar absorptivities at different wavelength leads to non-linearities in Beer’s Law • Stray radiation • Mistmatched cells • Non-zero intercept in calibration curve How might one avoid?
How to make a UV-vis absorption measurement • Make a 0%T (dark current) measurement • Make a 100%T (blank) measurement • Measure %T of sample • Determine %T ratio and thus the absorbance value
Instrumental noise • Precision of measurement is limited by instrumental noise sources
Use proper slit widths • Resolution improves with narrower slit width, but power decreases as square of slit width. • 10-fold narrower slit gives 100x less radiant power • General rule: Use the widest slit that gives required resolution.
Deuterium lamp Most common UV source Arc between oxide-coated filament and metal electrode Low voltage and low pressure of D2 Aperture gives 1-1.5 mm spot Continuum from 190-400 nm, emission lines >400nm Light sources for UV-vis
Tungsten filament Most common visible and NIR source Blackbody radiator useful from 350-2500 nm Power varies as (operating voltage)4; need stable power supply! Tungsten-halogen sources can operate at higher temperatures and give off more UV light. Light sources for UV-vis, continued
Light sources for UV-vis, continued2 • LEDs • 375-1000 nm • Semi-monochromatic (20-50 nm FWHM) • “White” LEDs use phosphor to give 400-800 nm continuum • Keychain flashlights • Xenon arc lamps • Very intense source • Continuum from 200-1000 nm, peaking at 500 nm
Instrument configurations • Single-beam • Double-beam • Multichannel
Single-beam UV-vis spectrometers Skoog, Fig. 13-13 Good light throughput, but what if the source power fluctuates?
Double-beam in time UV vis spectrometers • Beam is split in two, but measured by same detector “in time” because the beam appears in 2 places over one cycle in time • - Sample • - Reference • Sample • Reference What if the source power fluctuates? Skoog, Fig. 13-13
Double-beam in space UV-vis spectrometers • Beam is split into two paths and measured by matched detectors • Difficult to find perfectly matched detectors “in space” because two beams are always present in space Continuous Reference What if the source power fluctuates? Continuous Sample
Cary 100 double beam spectrometer - Sample - Dark - Reference - Dark
Cary 300 double-dispersing spectrophotometer • Why does double dispersion help with extending absorption to ~5.0 absorbance units? • Two gratings • Reduced stray light • 0.00008% or less • Improved spectral resolution • Bandwidth < 4 nm • If Abs = 5.0, %T = ?
Dispersing optic (grating or prism) used to separate different wavelengths in space. Detection with diode array or CCD Fast acquisition of entire spectrum Multichannel UV-vis spectrometers
Diode array spectrophotometers • Fairly inexpensive, but good quality fiber optic models available for ~$3000. • Ocean Optics • StellarNet
Diode array spectrophotometers http://www.oceanoptics.com/products/usb4000.asp 89 mm 3.5 inches 250 specta per sec
What is UV-visible absorption measuring? • The absorption of a photon generates an electronic excited state • UV-vis energy often matches up with transitions of bonding electrons • Often relatively short lifetimes (1-10 nsec) • Relaxation can occur non-radiatively • or by emission of radiation (fluorescence or phosphorescence)
Absorption signatures of various organic functional groups • Commonly observed transitions are np* or pp* • Chromophores have unsaturated functional groups • Rotational and vibrational transitions add detail to spectra • Single bond excitation energies (ns*) are in vacuum UV (l < 185 nm) and have very low molar absorptivities e normalized with respect to path length and concentration
Absorption signatures of various organic functional groups, continued • Conjugation causes shift to longer wavelength • pp* transitions more 10-100x or more intense than np* • Nonbonding electrons of heteroatoms in saturated compounds can give UV absorbance signature. Note distinct lmax values
Spectra of inorganic (metal and non-metal) ions and ionic complexes • Inorganic anions have broad UV absorption bands from non-bonding electrons. • Transition metal ions and complexes absorb visible light upon excitation between filled and unfilled d-orbitals. • Dependent upon oxidation state and coordination environment.
Spectra of lanthanide and actinide ions • Lanthanide and actinide ions absorptions come from excitation of 4f and 5f electrons. • f electrons are shielded from s, p, and d orbitals and have narrow absorption bands
Charge-transfer complexes • Electron donor absorbs light and transfers to acceptor. • Internal red-ox process • Typically very large molar absorptivities (e>10,000) • Metal-to-ligand charge transfers (MLCT) • Ligand-to-metal charge transfer (LMCT) http://www.piercenet.com/browse.cfm?fldID=876562B0-5056-8A76-4E0C-B764EAB3A339
The environment that the analyte is in can have profound effect on the observed spectrum In the gas phase, rotational and vibrational fine structure can be observed given adequate spectral bandwidth. In solid form or in solution, molecules cannot rotate as freely and differences in rotational energy level are not observable. Solvent molecules can also lead to a loss of vibrational detail in the absorbance spectrum. Environmental effects The visible absorption spectrum of sym-tetrazine: I, at room temperature in the vapour; II, at 77o K in a 5 : 1 isopentane-methylcyclohexane glass, III, in cyclohexane; and IV, in aqueous solution at room temperature. J. Chem. Soc., 1959, 1263-1268.
acetone isopropanol ethanol Solvatochromism • The polarity of solvents can preferentially stabilize the ground or excited state leading to different energy level gaps and thus a solvent-dependent absorption spectrum. http://scienceblogs.com/moleculeoftheday/2007/02/reichardts_dye_solvatochromic.php http://www.uni-regensburg.de/Fakultaeten/nat_Fak_IV/Organische_Chemie/Didaktik/Keusch/p28_neg_sol-e.htm
Solvatochromism, continued Positive solvatochromism (red shift) Bathochromic Negative solvatochromism (blue shift) Hypsochromic Resonance structures of 4,4'-bis(dimethylamino)fuchsone http://www.chemie.uni-regensburg.de/Organische_Chemie/Didaktik/Keusch/D-pos_sol-e.htm http://www.uni-regensburg.de/Fakultaeten/nat_Fak_IV/Organische_Chemie/Didaktik/Keusch/p28_neg_sol-e.htm
Qualitative versus quantitative analysis via UV-vis absorption • What are the objectives of qualitative versus quantitative UV-visible absorption spectroscopy? • How might the application guide slit width selection? • Large slit width = good sensitivity but poor resolution • Small slit width = poor sensitivity but good resolution • Qualitative work needs __?? • Quantitative work needs __?? Visible region absorbance spectrum for cytochrome c with spectral bandwidths of (1) 20 nm, (2) 10 nm, (3) 5 nm, and (4) 1 nm.
Attributes of UV-visible absorption for quantitative analysis • Applicable to organic and inorganic species • Good detection limits: 10-100 mM or better • Possible need for larger slit widths to achieve best sensitivities • Moderate to high selectivity • Accuracy: 1-3% or better • Ease and convenience ($$$) of data acquisition
Considerations for using UV-vis for quantitative measurements • Directly monitor absorbing analytes; usually non-destructive • Can use reagents that react with colorless analyte to generate measureable species • Greatly increase molar absorptivity • Thiocyanate (Fe, Co, Mo), H2O2 (Ti, V, Cr), iodide (Bi, Pd, Te) • Monitor at wavelength of max absorption, max at lmax • Greatest change in absorbance per unit concentration • Absorbance least sensitive to a small change in wavelength • Relaxes requirement on instrument to stringently achieve the exact same wavelength • UV-visible absorbance sensitive to environment, pH, temperature, high electrolyte concentration, interfering species. Be careful with standards • Use matched cells.
Calibration and mixture analysis • Generate calibration curve (linear) using external standards • Must use multiple standards • Standards hopefully match sample matrix • Matrix matching is hard—consider using standard addition. • Mixtures are additive • Need to monitor at as many wavelengths as components to be analyzed. • Requirement of solving multiple equations with multiple unknowns.