Download
1 / 25
250 likes | 370 Views
Predicting with lines of Best Fit. Correlation. Correlation A measure of association between two numerical variables. Example (positive correlation) Typically, in the summer as the temperature increases people are thirstier. Temperature (F). Water Consumption (ounces). 75. 16. 83. 20.

E N D
Correlation • Correlation • A measure of association between two numerical variables. • Example (positive correlation) • Typically, in the summer as the temperature increases people are thirstier.
Temperature (F) Water Consumption (ounces) 75 16 83 20 85 25 85 27 92 32 97 48 99 48 Specific Example For seven random summer days, a person recorded the temperatureand their water consumption, during a three-hour period spent outside.
Positive Correlation Negative Correlation Direction of Association
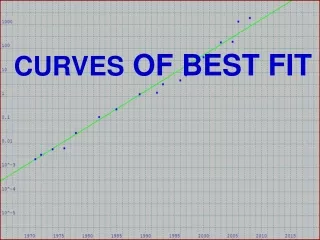
Regression • Linear Regression • Process of finding the line of best fit for a set of data.
Regression: 3 Main Purposes • To describe (or model) • To predict—AKA Extrapolation (or estimate) • To control (or administer)
Example • Plan an outdoor party. • Estimate number of soft drinks to buy per person, based on how hot the weather is. • Use Temperature/Water data and regression.
5. Interpreting and Visualizing • Interpreting the result: y = mx+ b • The valueofmis the slope • The value of bis the y-intercept
How about this Result? • y = 1.5x - 96.9 • Interpret this equation. Tell me what you know.
Interpretation in Context • Slope = 1.5 (ounces)/(degrees F) • for each 1 degree F increase in temperature, you expect an increase of 1.5 ounces of water drank.
Interpretation in Context y-intercept = -96.9 • For this example, when the temperature is 0 degrees F, then a person would drink about -97 ounces of water. • That does not make any sense! • Our model is not applicable for x=0.
Prediction Example • Predict the amount of water a person would drink when the temperature is 95 degrees F. • Solution: Substitute the value of x=95 (degrees F) into the regression equation and solve for y (water consumption).If x=95, y=1.5*95 - 96.9 = 45.6 ounces.
Real Life Applications Cost Estimating for Future Space Flight Vehicles (Multiple Regression)
Real Life Applications • Predicting Student Grades Based on Time Spent Studying
Real Life Applications • . . . • What ideas can you think of?
Practice Problems • Measure Height vs. Arm Span • Find line of best fit for height. • Predict height forone student not indata set. Checkpredictability of model.
Practice Problems • Is there any correlation between shoe size and height? • Does gender make a difference in this analysis?