Download
1 / 29
290 likes | 484 Views
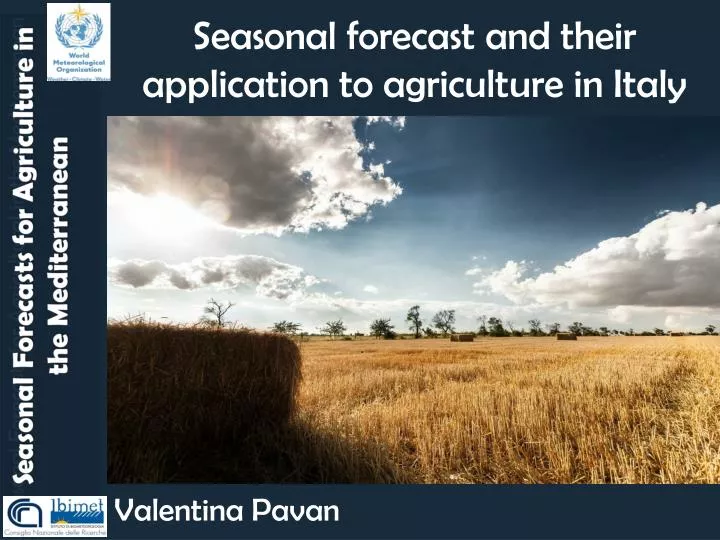
Seasonal forecast and their application to agriculture in Italy. Valentina Pavan. Outline. Review of concept on seasonal forecasts Seasonal predictions of climate impacts: the iColt system Description of the different components of the iCOLT system and their predictive ability

E N D
Seasonal forecast and their application to agriculture in Italy Valentina Pavan
Outline • Review of concept on seasonal forecasts • Seasonal predictions of climate impacts: the iColt system • Description of the different components of the iCOLT system and their predictive ability • Conclusions
Concept on seasonal predictions • When issuing a seasonal prediction we need to concentrate on seasonal indices: day-to-day variability can’t be predicted • Since predictability is medium-low, very often it is necessary to concentrate on the sign of an anomaly or exclude one tercile. • When issuing a prediction it is important to remember which is the reliability of the forecast system in the conditions considered.
Seasonal impact prediction systems Observed local climate data (INPUT) Observed local application data (INPUT) CGCM seasonal predictions (INPUT) Calibration/ downscaling scheme Impact model Final impact seasonal predictions (OUTPUT)
The iCOLT system iCOLTis a system providing a probabilistic early assessment of irrigation demand of crops over the Emilia-Romagna regional plain area. The system predictions (operational since 2010) has been published yearly via the agency official web site.
The iCOLT system scheme Observed local weather data (INPUT) Observed sat. data and field surveys (INPUT) Water bal. and crop dev. model (CRITERIA) Calibration and downscaling scheme Multi-model seasonal predictions (INPUT) Weather Generator Probabilistic irrigation seasonal predictions (OUTPUT)
Seasonal irrigation prediction - results Validationforyears 2011, 2012 and 2013 1- The interannual variabilityiscaptured 2- Spatialvariabilityiscaptured Villani et al, 2014, ECMWF Newsletter
iCOLT sources of predictability • Seasonal predictions • Spatial distribution of crop types (with different irrigation needs!) • Sub-surface water table depth, linked to observed precipitation up to May
ARPA-SIMC calibration method and products Seasonal forecast products are • affected by model biasses and errors, • at a low spatial resolution especially for use in impacts model predictions (which require a resolution of the order to 10Km or less) Predictions are calibrated on local observational data-sets
Assumptions and requirements • Existence of a stable link between large-scale circulation variability and local climate • Model predictions to be calibrated must be produced using the same version of the model (hindcasts) • Availability of a local surface observational analysis or of a good quality obs. data-set
ARPA-SIMC calibration method PC An. EOF Obs+ PC pred PC An. Large-scale predictions (Z500-T850) 2.5°x2.5° 1991-2013 Predictors Maps and tables prob. predictions MLR in cross-validation Local observations - UCEA analysis 35Km (climate indices from daily prece T) 1991-2013 Predictands
Improvements obtained • Removal of biases and increase of spatial resolution Possibility to use ensemble calibrated predictions in impact models • Improvement of predictions skill scores
Conclusions on SD scheme • Calibrated seasonal multi-model seasonal predictions have better skills than DMO multi-model predictions • Over Italy and in the summer season the DMO Tmax predictions skill is mostly due to the correct representation of linear trends. • Calibration can still produce skilful predictions even if trends are removed. • The presence of extreme events in the data-set has a strong influence on the evaluation of the skill of the system and on the calibration process.
The weather generator Since calibrated probabilistic seasonal prediction are produced only for seasonal climate indices, while the water balance are crop development model needs in input daily precipitation and minimum and maximum temperature data, it is necessary to use a local weather generator.
The weather generator Tmin Tmax Time series of daily precipitation, Tminand Tmax Tmax difference between dry and wet days Weathergenerator Total Precipitation Freq. of wet days Freq of a wet day after a wet day
Weather generator Weather Generator needs: • Long local daily time sires of observed precipitation, Tmin and Tmax • Normalised anomalies for each of the 6 indices Weather Generator limitation: as for now it works locally and has no spatial coherence
The impact model The impact model consists of • An empirical water table depth model • A water balance and crop growth model (CRITERIA)
The water table model Observed local past weather data – prec Temp (INPUT) Empirical water tabledepth model (using ETP Hargreaves) Water table depth prediction (OUTPUT) Observed local past water table depth data (INPUT) Tomei F., G. Villani, G. Antolini and V. Marletto, 2012: Sviluppodiun’equazioneempirica per la stimadellaprofonditàdifaldaipodermica in Emilia-Romagna. Proceedingsof AIAM.
CRITERIA Local weather data (INPUT) Soil moisture map - mm (OUTPUT) Water balance and cropdevelopment model (CRITERIA) Water table depth (INPUT) Leaf Area Index Map (OUTPUT) Soil texture maps fixed (INPUT) Seasonal irrigation need - mm (OUTPUT) Crop type maps (INPUT) Marletto V., Zinoni F., Criscuolo L., Fontana G., Marchesi S., Morgillo A., Van Soetendael M., Ceotto E., Andersen U., 2005, Tellus A, 57(3), 488-497.
1. Distribution of crop types Obtained every year by combining • Detailed satellite images at several times: visible and infraredbands, @10-30m spatialresolution • Field surveys:during each acquisition window a team of two technicians go around the study area to collect field information and confirm interpretation of satellite images
1. Distribution of crop types • November • February • April • June (optional) Acquisition time-windows
Distribution of type of crops – satellite data Clouds and fog cover are the major constrains in the November and February windows for Northern Italy. It’s mandatory to choose a satellite platform with frequent revisiting time, able to increase chances of good acquisition. To prevent different crop’s development stages, we prefer a sensor with wide swath width, able to acquire the whole study area in only one pass.
Distribution of type of crops – field surveys What you need during field survey? • GPS trimble or similar able to manage georeferenced images and data base • BBCH manuals (to identify current phenological stage) and agro-phenobullettins (to obtain information on the present observed phenological stage)
Distribution of type of crops – product For each reclamation consortium are identified the extension for each crop class (classified depending on irrigation needs)
Conclusions • ARPA-SIMC has built a system able to produce seasonal prediction of irrigation need over Emilia-Romagna and has used it operationally in the last four years • Preliminary results: the system is able to capture to a satisfactory degree both spatial and year to year variability • Sources of predictability seems to be: • Probabilistic seasonal predictions; • Spatial distribution of crop types • Sub-surface water table depth