Download
1 / 74
740 likes | 745 Views
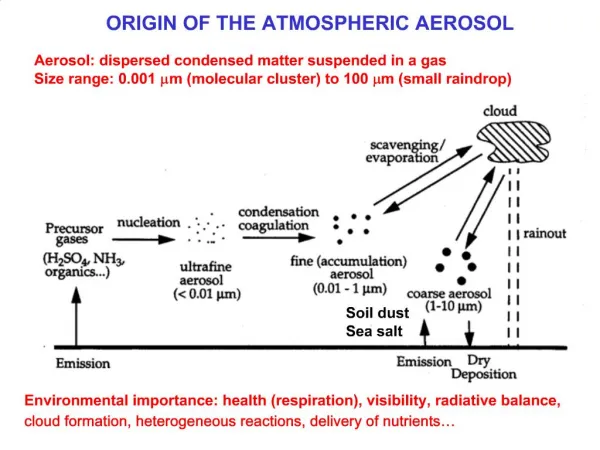
Four open datasets of atmospheric ion and aerosol measurements. Four open datasets of atmospheric ion and aerosol measurements. Hannes.Tammet@ut.ee with acknowledgements to colleagues providing the data for open access datasets.

E N D
Four open datasets of atmospheric ion and aerosol measurements Four open datasets of atmospheric ion and aerosol measurements Hannes.Tammet@ut.ee with acknowledgements to colleaguesproviding the data for open access datasets
The DataCite global consortium (https://www.datacite.org) supports archiving of research data and helps to assign to datasets digital object identifiers (DOI). This opportunity is used uploading datasets of atmospheric ion and aerosol measurements toa safe repository and making the data accessible for everybody.
ATMEL2007A ► http://dx.doi.org/10.15155/repo-1 FinEstIon2003_06 ► http://dx.doi.org/10.15155/repo-4 Hyytiala08_10aerosol ► http://dx.doi.org/10.15155/repo-3 Nanoion2010_11 ► http://dx.doi.org/10.15155/repo-2 Today only small part of information available in these datasets is utilized in the aerosol research.
1. ATMEL2007A Preliminary version was presented in Pikajärve workshop 2005. Publication: Tammet, H. (2009). A joint dataset of fair-weather atmospheric electricity. Atmos. Res., 91, 194–200. The amount of included hourly average values is about 12,000,000. A focus for aerosol research is the subset of measurements from1 August 1972 to 31 December 1983 on Wank Peak, a.s.l. 1780 m. The measurements were arranged by the Director of the Fraunhofer Institute of Atmospheric Environment at Garmisch-Partenkirchen Dr. Reinhold Reiter. Wank data include hourly averages of CN concentrations routinely recorded using General Electric CNC (designed by T.A. Rich) equipped with automatically commutable diffusion battery. CN concentration was recorded:1without diffusion battery, 2with electrically neutral diffusion battery, and 3with charged diffusion battery. Other recorded quantities are concentrations of air ions, concentration of NOx, UV-radiation and total radiation, etc.
ATMEL2007A tablemaker DataCite version of ATMEL2007A includes a new tool: the Tablemaker.It allows extract Excel tables much easier than the universal tool called the DataDiurna data manager. Additionally, all data are presented simultaneously as a DataDiurna diary and as seven large Excel tables. EXAMPLE: 1. Prepare description of the table as a text filetable_description.txt ------------------------------------- 1: Wank_78_83.xls 2: 19780101 19831231 3: -999 CNR1:cm-3@Wank CNR2:cm-3@Wank NOX:ug/m3@Wank Rad:W/m2@Wank UV:mW/m2@Wank 2. Drag table_description.txt onto the icon of ATMEL2007tablemaker.exe
Calculate: CN-coarse = CNR2 CN-fine = CNR1 – CNR2 UV/Rad = 1000 * UV / Rad
2. FinEstIon2003_06 Contains air ion mobility and fine nanoparticle size distribution measurements in Hyytiälä, Tahkuse. Preliminary version of the dataset was presented in Pühajärve workshop 2007. For DataCite repository the dataset was converted into a large Excel table Finestion.xls and accompanied witha new tool Finestractor.exe (why?) Finestion.xls is a text file, where every data line presents measurements for a 10-minute period. All possible periods are saved without any omission for all 4 years. The number of hours during four years is (365 + 366 + 355 + 355) × 24 = 35064 and number of 10-minute periods is 210384. Thus the file consist 210385 text lines, where the first line is the header. Every line contains 273 tab-delimited words. The words of the header are the brief names of variables and the words of following lines are values of the variables.
FinEstIon2003_06 In addition to the numerical table, the dataset contains a subsetof diagrams for measurements in Tartu. Excerpt from the index:
3. Hyytiala08_10aerosol Introduced in the paper Tammet, H., Kulmala, M. (2014). Empiric equations of coagulation sink of fine nanoparticles on background aerosol optimized for boreal zone. Boreal Environ. Res., 19, 115–126. Contains results of routine measurements during 3 years of 2008–2010. The particle size range from 3 nm to 15μm is split into 60 fractions and the recordsof distribution function are presented for 21682 hours of measurements. The dataset includes three files: Data_Hyytiala08_10aerosol.xls – a table, which contains 60 columns of the particle size distribution and 30 columns of complementary variables. Description_Hyytiala08_10aerosol.pdf – detailed description of origin and structure the data. Additionally includes sample diagrams, which illustrate the data and may provoke new ideas for studies on atmospheric aerosol. Package_Hyytiala08_10aerosol.zip – a compressed package, which contains both the data file and the description file. The package is to be downloaded to a personal computer, unzipped and used offline.
4. Nanoion2010_11 Described in the paper Tammet, H., Komsaare, K., Hõrrak, U. (2014). Intermediate ions in the atmosphere. Atmos. Res., 135&136, 263–273. Includes results of a measurement campaign startedat 1 April 2010 and finished at 8 November 2011. The instrument SIGMA is described in the paper Tammet, H. (2011). Symmetric inclined grid mobility analyzer for the measurement of charged clusters and fine nanoparticles in atmospheric air.Aerosol Sci. Technol., 45, 468–479. The author acknowledges Kaupo Komsaare for taking care of the instrument, Sander Mirme for presenting the meteorological data, and Urmas Hõrrak for general arrangements and discussions. The high-quality measurements cover 7647 hours, which is about 54% of the full 587 day measurement period.
Includes contour plots for 147 days, which satisfy the requirements: uninterrupted diurnal set of 288 five-minute records, no considerable disturbances and low instrumental noise.
Noise: excerpt from Hyytiälä SMPS measurements(for comparison)
Noise: excerpt from SIGMA measurements (20110318, + ions) Explanation of low noise: air flow rate about 2 m3/min