Download
1 / 1
20 likes | 538 Views
Four Measurements of Planck’s constant. Physics Group: Mei Mei Chan, Travis Christolear , David Lao, Alex Pearson, Chris Perez, Luke Singleton, Colin Smith, Po Tsui Faculty Advisors: Vladimir Gasparyan , Thomas Meyer.

E N D
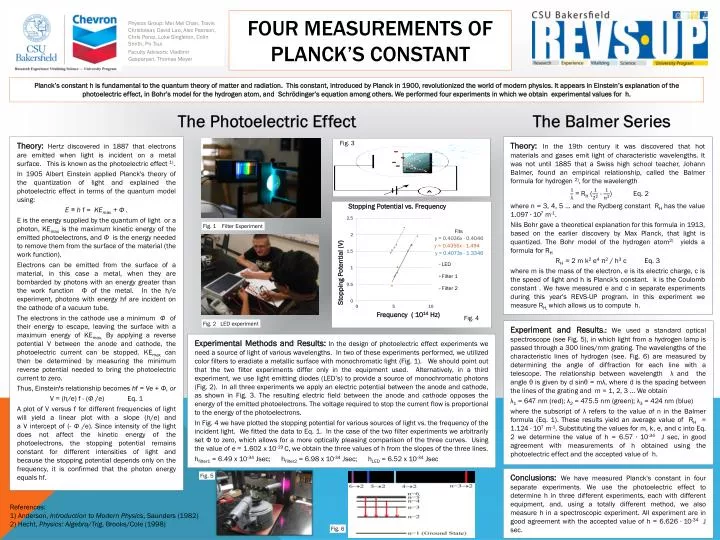
Four Measurements of Planck’s constant Physics Group: Mei Mei Chan, Travis Christolear, David Lao, Alex Pearson, Chris Perez, Luke Singleton, Colin Smith, Po Tsui Faculty Advisors: Vladimir Gasparyan, Thomas Meyer Planck’s constant h is fundamental to the quantum theory of matter and radiation. This constant, introduced by Planck in 1900, revolutionized the world of modern physics. It appears in Einstein’s explanation of the photoelectric effect, in Bohr’s model for the hydrogen atom, and Schrödinger’s equation among others. We performed four experiments in which we obtain experimental values for h. The Photoelectric Effect The Balmer Series Theory: Hertzdiscovered in 1887 that electrons are emitted when light is incident on a metal surface. This is known as the photoelectric effect 1). In 1905 Albert Einstein applied Planck's theory of the quantization of light and explained the photoelectric effect in terms of the quantum model using: E ≡ hf = KEmax+ Φ . E is the energy supplied by the quantum of light or a photon, KEmax is the maximum kinetic energy of the emitted photoelectrons, andΦ is the energy needed to remove them from the surface of the material (the work function). Electrons can be emitted from the surface of a material, in this case a metal, when they are bombarded by photons with an energy greater than the work function Φof the metal. In the h/e experiment, photons with energy hf are incident on the cathode of a vacuum tube. The electrons in the cathode use a minimum Φ of their energy to escape, leaving the surface with a maximum energy of KEmax.By applying a reverse potential V between the anode and cathode, the photoelectric current can be stopped. KEmax can then be determined by measuring the minimum reverse potential needed to bring the photoelectric current to zero. Thus, Einstein's relationship becomes hf = Ve + Φ, or V = (h/e) f - (Φ /e) Eq. 1 A plot of V versus f for different frequencies of light will yield a linear plot with a slope (h/e) and a V intercept of (- Φ /e).Since intensity of the light does not affect the kinetic energy of the photoelectrons, the stopping potential remains constant for different intensities of light and because the stopping potential depends only on the frequency, it is confirmed that the photonenergy equals hf. Theory: In the 19th century it was discovered that hot materials and gases emit light of characteristic wavelengths. It was not until 1885 that a Swiss high school teacher, Johann Balmer, found an empirical relationship, called the Balmerformula for hydrogen 2), for the wavelength = RH ( - ) Eq. 2 where n = 3, 4, 5 ... and the Rydberg constant RH has the value 1.097 ∙ 107 m-1. Nils Bohr gave a theoretical explanation for this formula in 1913, based on the earlier discovery by Max Planck, that light is quantized. The Bohr model of the hydrogen atom2) yields a formula for RH RH = 2 m k2 e4π2 / h3 c Eq. 3 where m is the mass of the electron, e is its electric charge, c is the speed of light and h is Planck's constant. k is the Coulomb constant . We have measured e and c in separate experiments during this year's REVS-UP program. In this experiment we measure RH, which allows us to compute h. Fig. 3 Fig. 1 Filter Experiment Fig. 4 Fig. 2 LED experiment Experiment and Results.: We used a standard optical spectroscope (see Fig. 5), in which light from a hydrogen lamp is passed through a 300 lines/mm grating. The wavelengths of the characteristic lines of hydrogen (see. Fig. 6) are measured by determining the angle of diffraction for each line with a telescope. The relationship between wavelength λ and the angle θ is given by d sinθ = mλ, where d is the spacing between the lines of the grating and m = 1, 2, 3 ... We obtain λ1 = 647 nm (red); λ2 = 475.5 nm (green); λ3 = 424 nm (blue) where the subscript of λ refers to the value of n in the Balmer formula (Eq. 1). These results yield an average value of RH = 1.124 ∙ 107 m-1. Substituting the values for m, k, e, and c into Eq. 2 we determine the value of h = 6.57 ∙ 10-34 J sec, in good agreement with measurements of h obtained using the photoelectric effect and the accepted value of h. Experimental Methods and Results:In the design of photoelectric effect experiments we need a source of light of various wavelengths. In two of these experiments performed, we utilized color filters to eradiate a metallic surface with monochromatic light (Fig. 1). We should point out that the two filter experiments differ only in the equipment used. Alternatively, in a third experiment, we use light emitting diodes (LED’s) to provide a source of monochromatic photons (Fig. 2). In all three experiments we apply an electric potential between the anode and cathode, as shown in Fig. 3. The resulting electric field between the anode and cathode opposes the energy of the emitted photoelectrons. The voltage required to stop the current flow is proportional to the energy of the photoelectrons. In Fig. 4 we have plotted the stopping potential for various sources of light vs. the frequency of the incident light. We fitted the data to Eq. 1. In the case of the two filter experiments we arbitrarily set Φ to zero, which allows for a more optically pleasing comparison of the three curves. Using the value of e = 1.602 x 10⁻¹⁹ C, we obtain the three values of h from the slopes of the three lines. hfilter1 = 6.49 x 10⁻³⁴Jsec; hfilter2 = 6.98 x 10⁻³⁴Jsec; hLED = 6.52 x 10⁻³⁴Jsec Conclusions:We have measured Planck's constant in four separate experiments. We use the photoelectric effect to determine h in three different experiments, each with different equipment, and, using a totally different method, we also measure h in a spectroscopic experiment. All experiment are in good agreement with the accepted value of h = 6.626 ∙ 10-34 J sec. Fig. 5 References: 1) Anderson, Introduction to Modern Physics, Saunders (1982) 2) Hecht, Physics: Algebra/Trig, Brooks/Cole (1998) Fig. 6