Download
1 / 18
190 likes | 394 Views
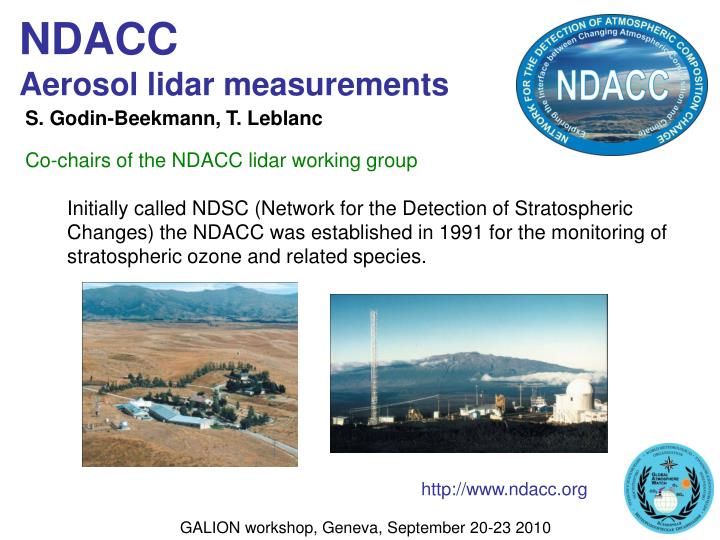
NDACC Aerosol lidar measurements. S. Godin-Beekmann, T. Leblanc. Co-chairs of the NDACC lidar working group. Initially called NDSC (Network for the Detection of Stratospheric Changes) the NDACC was established in 1991 for the monitoring of stratospheric ozone and related species.

E N D
NDACCAerosol lidar measurements S. Godin-Beekmann, T. Leblanc Co-chairs of the NDACC lidar working group Initially called NDSC (Network for the Detection of Stratospheric Changes) the NDACC was established in 1991 for the monitoring of stratospheric ozone and related species. http://www.ndacc.org GALION workshop, Geneva, September 20-23 2010
What is NDACC?Network for the Detection of Atmospheric Composition Change • A set of more than 70 high-quality, remote-sensing and balloon-sounding research sites for • observing and understanding the physical / chemical state of the stratosphere and upper/ free troposphere • assessing the impact of stratospheric changes on the underlying troposphere and on global climate GALION workshop, Geneva, September 20-23 2010
NDACC goals • Study the temporal and spatial variability of atmospheric composition and structure • Provide early detection and subsequent long-term monitoring of changes in the chemical and physical state of the stratosphere and upper troposphere • Establish links between changes in stratospheric O3, UV radiation at the ground, tropospheric chemistry, and climate • Provide independent validations, calibrations and complementary data for space-based sensors of the atmosphere GALION workshop, Geneva, September 20-23 2010
Aerosol lidar sites andNDACC lidar working group Ny Ålesund (78.9°N, 11.9°E) O. Schrems & R. Neuber (AWI) Multi-wavelength system (excimer and Nd:YAG) making winter measurements since 1991.Tropospheric aerosol capability since 1999 Thule (76.5°N, 68.7°W) G. Fiocco, A. DiSarra, D. Fua (U. Roma) Winter-only measurements since November 1990; year-round operation with daylight observations since July 1993. Problems 1998, 1999, 2004, or 2005. Garmisch (47.5°N, 11.1°E) H. Jäger, T. Trickl (IMK-IFU) Ruby system from 1976 to 1990 and as an Nd:YAG system since 1991. OHP (44°N, 6°E) C. David, P. Keckhut (CNRS) Began NDACC operations in March 1991. Table Mountain (34.4°N, 117.7°W) S. McDermid, T. Leblanc (JPL) Aerosol, ozone, and temperature: database extends back to February 1988. Hawaii (19.5°N, 155.6°W) J. Barnes (GMD) Ruby and Nd:YAG systems; aerosol database extends back to 1974 for ruby system and April 1994 for Nd:YAG system; GALION workshop, Geneva, September 20-23 2010
Aerosol lidar sites (cont’d) Hawaii (Mauna Loa: 19.5°N, 155.6°W ) S. McDermid, T. Leblanc (JPL) Multi-wavelength system (ozone, temperature, and aerosol); July 1993. Lauder (45°S, 169.7°E) B. Liley (NIWA) 2 Nd:Yag lidar systems (Japanese and Italian). Currently under test. Dumont d’Urville (66.7°S, 140°E) C. David (CNRS), M. Snels (ISAC-CNR) Nd:Yag lidar system with depolarisation. Data from 1989 to 1998. New system since 2006. McMurdo (77.8°S, 166.6°E) M. Snels, F. Cairo (ISAC-CNR) Nd:Yag lidar system. Database extends back to 1990, from February to October 2 mobiles systems: • AT lidar elastic and Raman backscatter Nd:Yag lidar (T. McGee NASA) • MARL Mobile aerosol Raman lidar : stratospheric and tropospheric aerosols (O. Schrems, AWI). GALION workshop, Geneva, September 20-23 2010
Garmisch-Partenkirchen Horst Jäger, Thomas Trickl, Helmut Giehl
Institut für Meteorologie und Klimaforschung, (IMK-IFU), Garmisch-Partenkirchen Long term stratospheric integrated backscatter coefficient at Garmisch-Partenkirchen T. Trickl, H. Jäger, H. Giehl GALION workshop, Geneva, September 20-23 2010
Institut für Meteorologie und Klimaforschung, (IMK-IFU), Garmisch-Partenkirchen H. Jäger, J. Geophys. Res. 2005 GALION workshop, Geneva, September 20-23 2010
Pyrocumulonimbus case studies Backscatter coefficient at Garmisch-Partenkirchen Carnuth et al., Tellus B, 2002 Fromm et al., BAMS 2010 GALION workshop, Geneva, September 20-23 2010
Eyjafjallajökull volcano upper end of volcanic plume tropopause (typically) GALION workshop, Geneva, September 20-23 2010
Mauna Loa, Hawaii John E. Barnes, NOAA, ESRL
Recent observations from the NDACC NOAA/Mauna Loa Observatory lidar John E. Barnes, P.I. The 2009 Sarychev Eruption (48 deg N) on 12 June was first observed at Mauna Loa (20 deg N) on 1 July. The plot tracks the top and bottom altitudes (left axis), and total backscatter (right axis) while the layer could be distinguished from the background. GALION workshop, Geneva, September 20-23 2010
Increase in Stratospheric Aerosol Between 2000 and 2007 a significant increase (~5%/yr) in stratospheric aerosol was observed both in total and in altitude layers (top 3 plots - left axis). Hofmann, Barnes et al. (GRL, 2009) suggested increased coal burning could be the cause. The trend has not continued since 2007. Recent work suggests a few small eruptions during the period can also explain the increase. GALION workshop, Geneva, September 20-23 2010
Results from Lauder, NZ Ben Liley, NIWA NIWA’s Lauder Site45.0S, 169.7E
Results from Lauder, NZ • In the era since Pinatubo, stratospheric aerosol declined to a minimum in the late 1990s, but has since increased by 40% in the total stratospheric column (whether measured by integrated optical depth or IBC). In conjunction with similar observations at Mauna Loa, Boulder, and Garmisch, and with modelling studies, we think that the increase comes from increased coal burning in China. Something to watch for henceforth is that: • The emissions pattern may have changed in recent times (Li, C., et al., 2010), • Recent large reduction in sulfur dioxide emissions from Chinese power plants observed by the Ozone Monitoring Instrument, (Geophys. Res. Lett., 37, L08807, doi:10.1029/2010GL042594.)