Download
1 / 111
1.11k likes | 1.11k Views
The Standard Deviation as a Ruler and the Normal Model. Chapter 6. Objectives:. Standardized values Z-score Transforming data Normal Distribution Standard Normal Distribution 68-95-99.7 rule Normal precentages Normal probability plot. The Standard Deviation as a Ruler.

E N D
The Standard Deviationas a Ruler and the Normal Model Chapter 6
Objectives: • Standardized values • Z-score • Transforming data • Normal Distribution • Standard Normal Distribution • 68-95-99.7 rule • Normal precentages • Normal probability plot
The Standard Deviation as a Ruler • The trick in comparing very different-looking values is to use standard deviations as our rulers. • The standard deviation tells us how the whole collection of values varies, so it’s a natural ruler for comparing an individual to a group. • As the most common measure of variation, the standard deviation plays a crucial role in how we look at data.
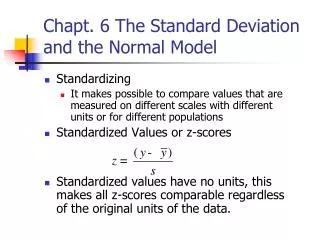
Standardizing with z-scores • We compare individual data values to their mean, relative to their standard deviation using the following formula: • We call the resulting values standardized values, denoted as z. They can also be called z-scores.
Standardizing with z-scores (cont.) • Standardized values have no units. • z-scores measure the distance of each data value from the mean in standard deviations. • A negative z-score tells us that the data value is below the mean, while a positive z-score tells us that the data value is above the mean.
Benefits of Standardizing • Standardized values have been converted from their original units to the standard statistical unit of standard deviations from the mean (z-score). • Thus, we can compare values that are measured on different scales, with different units, or from different populations.
WHY STANDARDIZE A VALUE? • Gives a common scale. • We can compare two different distributions with different means and standard deviations. • Z-Score tells us how many standard deviations the observation falls away from the mean. • Observations greater than the mean are positive when standardized and observations less than the mean are negative. 2.15 SD Z=-2.15 This Z-Score tells us it is 2.15 Standard Deviations from the mean
Example: Standardizing • The men’s combined skiing event in the in the winter Olympics consists of two races: a downhill and a slalom. In the 2006 Winter Olympics, the mean slalom time was 94.2714 seconds with a standard deviation of 5.2844 seconds. The mean downhill time was 101.807 seconds with a standard deviation of 1.8356 seconds. Ted Ligety of the U.S., who won the gold medal with a combined time of 189.35 seconds, skied the slalom in 87.93 seconds and the downhill in 101.42 seconds. • On which race did he do better compared with the competition?
Solution: • Slalom time (y): 87.93 sec. Slalom mean : 94.2714 sec. Slalom standard deviation (s): 5.2844 sec. • Downhill time (y): 101.42 sec. Downhill mean : 101.807 sec. Downhill standard deviation (s): 1.8356 sec. • The z-scores show that Ligety’s time in the slalom is farther below the mean than his time in the downhill. Therefore, his performance in the slalom was better.
Your Turn: WHO SCORED BETTER? • Timmy gets a 680 on the math of the SAT. The SAT score distribution is normal with a mean of 500 and a standard deviation of 100. Little Jimmy scores a 27 on the math of the ACT. The ACT score distribution is normal with a mean of 18 and a standard deviation of 6. • Who does better? (Hint: standardize both scores then compare z-scores)
Timmy: Timmy’s z score is further away from the mean so he does better than Little Jimmy who’s only 1.5 SD’s from the mean Little Jimmy: Little Jimmy does better than average and is 1.5 SD’s from the mean but Timmy beats him because he is .3 SD further. TIMMY DOES BETTER
Combining z-scores • Because z-scores are standardized values, measure the distance of each data value from the mean in standard deviations and have no units, we can also combine z-scores of different variables.
Example: Combining z-scores • In the 2006 Winter Olympics men’s combined event, Ted Ligety of the U.S. won the gold medal with a combined time of 189.35 seconds. IvicaKostelic of Croatia skied the slalom in 89.44 seconds and the downhill in 100.44 seconds, for a combined time of 189.88 seconds. • Considered in terms of combined z-scores, who should have won the gold medal?
Solution • Ted Ligety: • Combined z-score: -1.41 • IvicaKostelic: • Combined z-score: -1.65 • Using standardized scores, Kostelic would have won the gold.
Your Turn: • The distribution of SAT scores has a mean of 500 and a standard deviation of 100. The distribution of ACT scores has a mean of 18 and a standard deviation of 6. Jill scored a 680 on the math part of the SAT and a 30 on the ACT math test. Jack scored a 740 on the math SAT and a 27 on the math ACT. • Who had the better combined SAT/ACT math score?
Solution: • Jill • Combined math score: 3.8 • Jack • Combined math score: 3.9 • Jack did better with a combined math score of 3.9, to Jill’s combined math score of 3.8.
Linear Transformation of Data • Linear transformation • Changes the original variable x into the new variable xnew given by xnew = a + bx • Adding the constant a shifts all values of x upward or downward by the same amount. • Multiplying by the positive constant b changes the size of the values or rescales the data.
Shifting Data • Shifting data: • Adding (or subtracting) a constant amount to each value just adds (or subtracts) the same constant to (from) the mean. This is true for the median and other measures of position too. • In general, adding a constant to every data value adds the same constant to measures of center and percentiles, but leaves measures of spread unchanged.
Example: Adding a Constant • Given the data: 2, 4, 6, 8, 10 • Center: mean = 6, median = 6 • Spread: s = 3.2, IQR = 6 • Add a constant 5 to each value, new data 7, 9, 11, 13, 15 • New center: mean = 11, median = 11 • New spread: s = 3.2, IQR = 6 • Effects of adding a constant to each data value • Center increases by the constant 5 • Spread does not change • Shape of the distribution does not change
Shifting Data (cont.) • The following histograms show a shift from men’s actual weights to kilograms above recommended weight:
Rescaling Data • Rescaling data: • When we divide or multiply all the data values by any constant value, all measures of position (such as the mean, median and percentiles) and measures of spread (such as the range, IQR, and standard deviation) are divided and multiplied by that same constant value.
Example: Multiplying by a Constant • Given the data: 2, 4, 6, 8, 10 • Center: mean = 6, median = 6 • Spread: s = 3.2, IQR = 6 • Multiple a constant 3 to each value, new data: 6, 12, 18, 24, 30 • New center: mean = 18, median = 18 • New spread: s = 9.6, IQR = 18 • Effects of multiplying each value by a constant • Center increases by a factor of the constant (times 3) • Spread increases by a factor of the constant (times 3) • Shape of the distribution does not change
Rescaling Data (cont.) • The men’s weight data set measured weights in kilograms. If we want to think about these weights in pounds, we would rescale the data:
Summary of Effect of a Linear Transformation • Multiplying each observation by a positive number b multiples both measures of center (mean and median) and measures of spread (IQR and standard deviation) by b. • Adding the same number a (either positive or negative) to each observation adds a to measures of center and to quartiles, but does not change measures of spread. • Linear transformations do not change the shape of a distribution.
Back to z-scores • Standardizing data into z-scores shifts the data by subtracting the mean and rescalesthe values by dividing by their standard deviation. • Standardizing into z-scoresdoes not change the shape of the distribution. • Standardizing into z-scoreschanges the center by making the mean 0. • Standardizing into z-scoreschanges the spreadby making the standard deviation 1.
Standardizing Data into z-scores Standardizing Data into z-scores
When Is a z-score BIG? • A z-score gives us an indication of how unusual a value is because it tells us how far it is from the mean. • A data value that sits right at the mean, has a z-score equal to 0. • A z-score of 1 means the data value is 1 standard deviation above the mean. • A z-score of –1 means the data value is 1 standard deviation below the mean.
When Is a z-score BIG? • How far from 0 does a z-score have to be to be interesting or unusual? • There is no universal standard, but the larger a z-score is (negative or positive), the more unusual it is. • Remember that a negative z-score tells us that the data value is below the mean, while a positive z-score tells us that the data value is above the mean.
When Is a z-score Big? (cont.) • There is no universal standard for z-scores, but there is a model that shows up over and over in Statistics. • This model is called the Normal model (You may have heard of “bell-shaped curves.”). • Normal models are appropriate for distributions whose shapes are unimodal and roughly symmetric. • These distributions provide a measure of how extreme a z-score is.
Smooth Curve (model) vs Histogram • Sometimes the overall pattern is so regular that it can be described by a Smooth Curve. • Can help describe the location of individual observations within the distribution.
Smooth Curve (model) vs Histogram • The distribution of a histogram depends on the choice of classes, while with a smooth curve it does not. • Smooth curve is a mathematical model of the distribution. • How? • The smooth curve describes what proportion of the observations fall in each range of values, not the frequency of observations like a histogram. • Area under the curve represents the proportion of observations in an interval. • The total area under the curve is 1.
Smooth Curve or Mathematical Model • Always on or above the horizontal axis. • Total Area under curve = 1 Area underneath curve=1
Normal Distributions(normal Curves) • One Particular class of distributions or model. • Symmetric • Single Peaked • Bell Shaped • All have the same overall shape.
DESCRIBING A NORMAL DISTRIBUTION The exact curve for a particular normal distribution is described by its Mean (μ) and Standard Deviation (σ). μ located at the center of the symmetrical curve σ controls the spread Notation: N(μ,σ)
More Normal Distribution • The Mean (μ) is located at the center of the single peak and controls location of the curve on the horizontal axis. • The standard deviation (σ) is located at the inflection points of the curve and controls the spread of the curve.
Inflection Points • The point on the curve where the curve changes from falling more steeply to falling less steeply (change in curvature – concave down to concave up). • Located one standard deviation (σ) from the mean (μ). Inflection point Inflection point
Are not Normal Curves • Why • Normal curve gets closer and closer to the horizontal axis, but never touches it. • Normal curve is symmetrical. • Normal curve has a single peak. • Normal curve tails do not curve away from the horizontal axis.
When Is a z-score Big? (cont.) • There is a Normal model for every possible combination of mean and standard deviation. • We write N(μ,σ) to represent a Normal model with a mean of μ and a standard deviation of σ. • We use Greek letters because this mean and standard deviation are not numerical summaries of the data. They are part of the model. They don’t come from the data. They are numbers that we choose to help specify the model. • Such numbers are called parameters of the model.
When Is a z-score Big? (cont.) • Summaries of data, like the sample mean and standard deviation, are written with Latin letters. Such summaries of data are called statistics. • When we standardize Normal data, we still call the standardized value a z-score, and we write
When Is a z-score Big? (cont.) • Once we have standardized, we need only one model: • The N(0,1) model is called the standard Normal model (or the standard Normal distribution). • Be careful—don’t use a Normal model for just any data set, since standardizing does not change the shape of the distribution.
Standardizing Normal Distributions • All normal distributions are the same general shape and share many common properties. • Normal distribution notation: N(μ,σ). • We can make all normal distributions the same by measuring them in units of standard deviation (σ) about the mean (μ). • This is called standardizing and gives us the Standard Normal Curve.
Standardizing & Z - SCORES • We can standardize a variable that has a normal distribution to a new variable that has the standard normal distribution using the formula: Substitute your variable as y Subtract the mean from your variable BAM! Pops out your z-score Then divide by your Standard Deviation
The Standard Normal Distribution • Shape – normal curve • Mean (μ) = 0 • Standard Deviation (σ) = 1 • Horizontal axis scale – Z score • No vertical axis
Z-SCORE Standard Normal Distribution N(μ,σ)
When Is a z-score Big? (cont.) • When we use the Normal model, we are assuming the distribution is Normal. • We cannot check this assumption in practice, so we check the following condition: • Nearly Normal Condition: The shape of the data’s distribution is unimodal and symmetric. • This condition can be checked with a histogram or a Normal probability plot (to be explained later).
The 68-95-99.7 Rule (Empirical Rule) • Normal models give us an idea of how extreme a value is by telling us how likely it is to find one that far from the mean. • We can find these numbers precisely, but until then we will use a simple rule that tells us a lot about the Normal model…
The 68-95-99.7 Rule (cont.) • It turns out that in a Normal model: • about 68% of the values fall within one standard deviation of the mean; (µ – σ to µ + σ) • about 95% of the values fall within two standard deviations of the mean; (µ – 2σ to µ + 2σ ) and, • about 99.7% (almost all!) of the values fall within three standard deviations of the mean. (µ – 3σ to µ + 3σ)
The 68-95-99.7 Rule (cont.) • The following shows what the 68-95-99.7 Rule tells us: