Download
1 / 11
120 likes | 240 Views
The Mean and Standard Deviation. Chapter 2. Learning Objectives. 1. calculate the mean of a variable 2 . calculate the standard deviation of variable 3 . think about possible transformations 4 . remember to use the correct units. Example: Nim Chimpsky. The Mean.

E N D
The Mean and Standard Deviation Chapter 2
Learning Objectives 1. calculate the mean of a variable 2. calculate the standard deviation of variable 3. think about possible transformations 4. remember to use the correct units
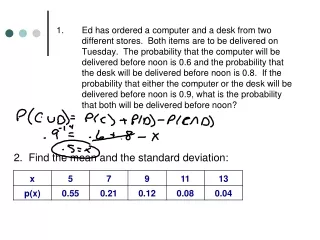
The Variance and Standard Deviation 1 Subtract the mean of the variable from each value. 2 Multiply this value by itself; in other words, square it. 3 Add these values together. 4 Divide by the number of cases minus one.
Younger 4 3 4 5 3 7 4 6 6 5 Older 5 1 9 6 4 4 10 7 4 10 (xi - mean) = (xi - mean)2 = (4-4.7) = -0.7 0.49 (3-4.7) = -1.7 2.89 (4-4.7) = - 0.7 0.49 (5-4.7) = 0.3 0.09 (3-4.7) = - 1.7 2.89 (7-4.7) = 2.3 5.29 (4-4.7) = -0.7 0.49 (6-4.7) = 1.3 1.69 (6-4.7) = 1.3 1.69 (5-4.7) = 0.3 0.09 Sum (Σ) 0 16.10 minutes squared
Standard deviation units are the same as the original variable.
Transforming data • Often distributions have long tails in the positive direction (called positive skew) • The ln and square root transformations often used to make the distribution more symmetric. • Sometimes a starting value is used. • Chile data set.
Summary • Mean is one measure of the center of the data. It is influenced by outliers. • Variance and standard deviation are measures of the spread of a distribution. • Some distributions are skewed. For positively skewed data the natural logarithm and the square root are often used.