Download
1 / 20
200 likes | 343 Views
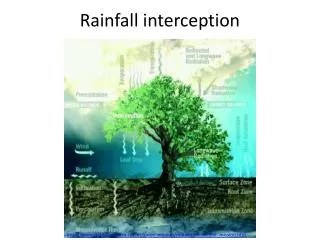
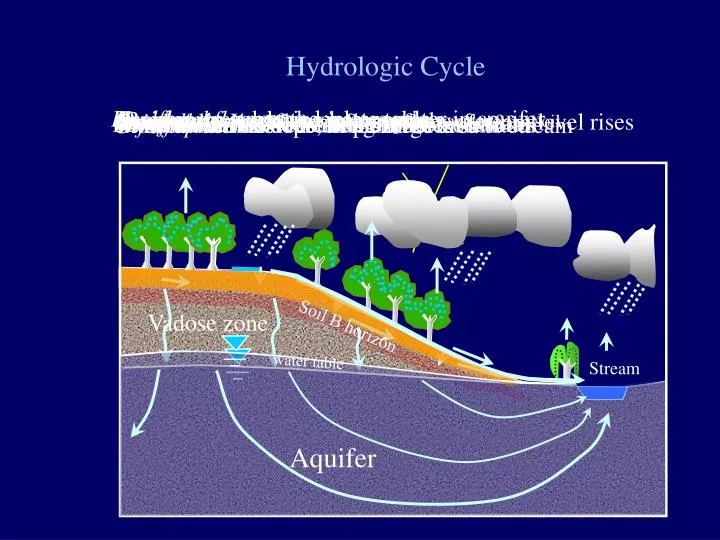
Vadose zone. Soil B horizon. Stream. Aquifer. Hydrologic Cycle. Baseflow to streams depletes water in aquifer. Recharge reaches the water table. Overland flow during heavy rain. Rain stops. Evaporation removes intercepted water. Overland + Interflow = Stormflow. Stream level rises.

E N D
Vadose zone Soil B horizon Stream Aquifer Hydrologic Cycle Baseflow to streams depletes water in aquifer Recharge reaches the water table Overland flow during heavy rain Rain stops Evaporation removes intercepted water Overland + Interflow = Stormflow. Stream level rises Rainfall Baseflow and ET continue until next rainfall Evapotranspiration (ET) from plants removes water from soil Water table rises Interflow downslope along B horizon Interception on trees, impermeable surfaces Infiltration into soil Groundwater flow from recharge area to stream water table
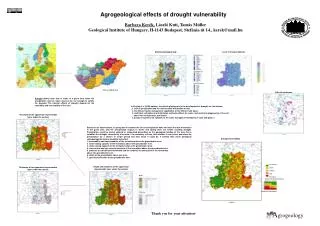
Hydrogeologic Regions Geologic controls on • Porosity and hydraulic conductivity • Layering, structure, and aquifer type • Water chemistry • Well yield
Limestone Appalachian Sedimentary Rock Piedmont Crystalline rock Coastal Plain Sand + clay Floridan Limestone Hydro-geology of the Southeast Ground Water Atlas http://capp.water.usgs.gov/gwa/gwa.html
Saprolite: K: 10-6-10-5 m/s S: 0.1-0.4 Transition Fractured metamorphic and igneous rock K: 10-11-10-3 m/s T: 1-100 m2/day S: 10-3 -10-4
R: 0.2 m/yr Hydrogeologic Conceptual Model
Fractured Rock Aquifers in Piedmont • K: 10-5-10-6 m/s bulk fractured rock Compare to 10-10 to 10-11 m/s for intact samples • T: 10-100 m2/day • Recharge: 0.03-0.3 m/yr • Well Yield: 30-300 gpm
Coastal Plain Santee River Delta
Atlantic Coastal Plain Columbia Myrtle Beach Sand clay
Flowing wells Edwards Aquifer, San Antonio, Texas Roswell Basin, NM, 3600 gpm
Coastal Plain Clastic Aquifers • T: 500-10,000 m2/day • Recharge: 0.05-0.5 m/yr • Well Yield: 100-5000 gpm
Limestone Appalachian Sedimentary Rock Piedmont Crystalline rock Coastal Plain Sand + clay Floridan Limestone Floridan Aquifer Ground Water Atlas http://capp.water.usgs.gov/gwa/gwa.html
Cave stream Dissolution
Floridan Aquifer • T: 1000-100,000 m2/day • Recharge: 0.03-0.5 m/yr • Well Yield: 1000-20,000 gpm
Comparison of SE Regions RegionT (m2/day)Recharge (m/yr)Qwell (gpm) Piedmont 1-100 0.03-0.3 10-100 Coastal Plain Clastic 500-10,000 0.05-0.5 100-5000 Floridan Limestone 1,000-100,000 0.03-0.5 1000-20,000