Download
1 / 23
230 likes | 236 Views
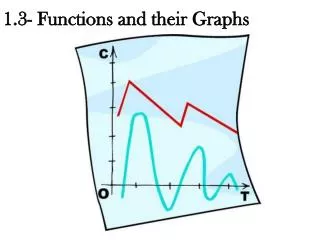
Functions and their Graphs. Instructions : Look at the input value and determine what rule applies to get the output value. Rule : add 5, n+5. RULE: multiply by 3, 3n or 3 • n Good job. Keep going. Rule: multiply by 10, 10 • n or 10n. Rule: subtract 2 or n - 2.

E N D
Instructions: Look at the input value and determine what rule applies to get the output value.
Rule: multiply by 10, 10 • n or 10n
Rule: multiply by 10; 10 • n, or 10n
Try more examples on this website: http://www.studyzone.org/testprep/math4/d/functiontable4l.cfm
A Relation can be represented by a set of orderedpairs of the form (x,y) Quadrant I X>0, y>0 Quadrant II X<0, y>0 Origin (0,0) Quadrant IV X>0, y<0 Quadrant III X<0, y<0
Graphing Relations • To graph the relation in the previous example: • Write as ordered pairs (-3,3), (1,-2), (1,1), (4,4) • Plot the points
(4,4) (-3,3) (1,1) (1,-2)
(-3,3) (1,1) (3,1) (4,-2)
Graphing an equation in 2 variables • Construct a table of values • Graph enough solutions to recognize a pattern • Connect the points with a line or curve
Graph: y = x + 1 Step 3: Step2: Step 1 Table of values y
Decide if the function is linear. Then evaluate for x = -2 • f(x) = -x2 – 3x + 5 • Not linear…. • f(-2) = -(-2)2 – 3(-2) + 5 • f(-2) = 7 • g(x) = 2x + 6 • Is linear because x is to the first power • g(-2) = 2(-2) + 6 • g(-2) = 2 • The domain for both is….. • All reals