Download
1 / 73
730 likes | 774 Views
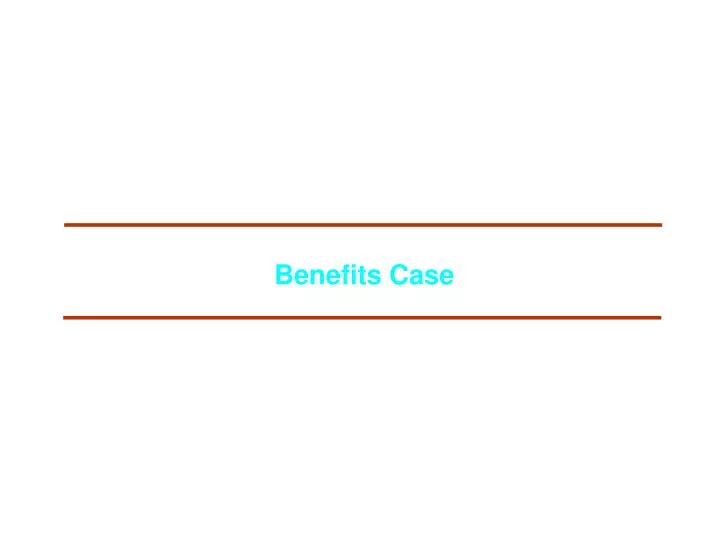
Benefits Case. Valuing the Gap. B. How much is it worth?. "To-Be ". "Gap". A. "As-Is". We Are Building a Foundation for the Future Beyond Consolidation. What is it?

E N D
Valuing the Gap B How much is it worth? "To-Be " "Gap" A "As-Is"
We Are Building a Foundation for the Future Beyond Consolidation
What is it? It is a Gemini deliverable to XXXX that sets the financial context, opportunities, and benefits to be delivered during implementation Why do we do it? To quantify the financial impact of opportunities that were identified during the analysis To explain the impact of benefits beyond implementation To begin to estimate the timing and sequence of benefits during implementation To create a rationale for making tough decisions and staying on track after the emotion of discovery has worn off and the challenges of implementation set in The Benefit Case Sets the Baseline
Triangulating on the Benefits Brown Papers Benchmarks Internal or External Validation of Opportunity Range Process Assessment of Opportunities and Causes Benefit Estimation Probes In-Depth Sampling and Analysis
Building the Benefits Benchmarks Internal Best Demonstrated Performance Previous Gemini Experience External Best Practice Probe Probe Probe Probe Probe Probe • • • Revenue Enhancement Cost Reduction Cost Avoidance Capital Reduction
Revenue $-$$ Expense $-$$ Capital $-$$ Total $-$$ Benefits Will Be Translated Into Measurable Results During Implementation Benefit Summary Cash Flow Projection Benefit Tracking Analysis & Design Project Start-up Results Delivery
"Soft or Stretch" Confident, delivery mechanism and means of measurement not as clear. May require a significant stretch on the part of Lanier organization Benefit Estimation "Hard" High confidence level, delivery mechanism and means of measurement well understood "Quick Hits" Hard benefits that can be substantially realized within six months of project start. "Potential" With respect to growth opportunities, represents the market or revenue gains achievable through implementation
$1.6 – 7.5MM $1.6 – 7.5MM $23-44 MM in Operational Improvement Benefits Identified One Time Annualized Breakeven Reductions Revenue Enhancements Capital Reductions $14.9 – 23.1MM 5.6 – 10.7 $20.5 – 33.8MM
Customer Service Sales Force Turnover Inventory and Distribution Collections Streamline AOP Process Benefits Summary Breakeven Reduction revenue Enhancement Capital Reduction $9.5 – 15.6MM 1.1 – 2.1 2.9 – 3.4 1.4 – 2.5 1.4 – 1.8 $0.9 – 1.1MM 4.7 – 9.6 $1.6 – 7.5MM $16.1 – 25.9MM $5.7 – 10.8MM $1.6 – 7.5MM
Customer Service Sales Force Turnover Inventory and Distribution Collections Streamline AOP Process Benefits Summary Breakeven Reduction revenue Enhancement Capital Reduction $9.5 – 15.6MM $0.9 – 1.1MM
Service Call Quality Increased First Call Completion Meter Billing Accuracy Customer Service Benefits Breakeven Reduction revenue Enhancement Capital Reduction $5.7 – 11.4MM 3.8 – 4.2 0.9 – 1.1MM Total $9..2 – 15.9MM $0.9 – 1.1MM
However, the measurement structure doesn't always support good business decisions or XXXX customer vision. Customer Service People are Doing What They Are Rewarded to Do Customer Service Representative (CSR) Service Manager AOP Perfect Match Customer Money HELP! Parts HELP! HELP! Measurement Rules Materials Expense CSR Number of Calls CSR Response Time Measurement Rules DOWN TIME Number of Calls Response Time Lanier promises 98% up-time Get there fast do as many as possible use minimal parts Get their fast do as many as possible But But
Attaining the XXXX Best Practice for RTFT will allow XXXXr to: Eliminate at least 115,000-230,000 redundant service calls annually Provide $5.7-11.4 MM in service costs which can be reinvested Customer Service 45% of the Calls a Technician Makes are Repeats of Calls Made in the Previous 30 Days Right the First Time Completions (RTFT) 100% 90% 45% Repeat Calls 80% 70% 70% 55% 60% 58 57 56 55 50% 51 51 Lanier Average Lanier Best Practice* 40% 30% 20% 10% 0% Piedmont Southwest Western Midwest Atlantic Southeastern Coastal Most importantly, the customer will have increased up-time and drive them closer to a delighted state. The less they see us the more they love us. *Lanier Internal Best Practice is the best quarterly performance by a district in July - September 1992 Source: CSR Activity Reports
Attaining the XXXXX for First Call Completions could: Eliminate 76,000+ redundant service contacts annually Provide $4MM resources which can be reinvested Customer Service 15% of Service Calls Require Additional Visits First Call Completions (FCC) Lanier Best Practice* 95% 85% 84 87 86 87 84 83 Lanier Average *XXXXr Internal Best Practice Average is the Average of the top 25 non-100% FCC performance technicians nationwide July-September 1992 Source: CSR Activity Reports
Measurements and rewards create on environment where what seems economical on a district level is non-economical for XXXXX. Customer Service A Major Drag on FCC Is Parts Availability Parts Causing Interrupted Work Orders 10651 9589 8995 8560 8148 6913 5549 20% of the unstocked parts generate 80% of the interrupted calls 3332 1547 508 2022 = Total parts for 1 month For instance, an investment of $200,000 in district parts cost, can eliminate a cost of $500,000 labor Source: Vision System
Improved meter readings and access will provide immediate revenue enhancements, as well as better product tracking information. Customer Service Meter Billing Inaccuracies Leave Money on the Table $24.4MM Meter Cards per year 72% 1% Error Minor Inaccuracies $1 million 18% 3% Error At least 18% of the cards are off by 16% Source: Random sampling meter cards
Customer Service Sales Force Turnover Inventory and Distribution Collections Streamline AOP Process Benefits Summary Breakeven Reduction Revenue Enhancement Capital Reduction $9.5 – 15.6MM 1.1 – 2.1 $0.9 – 1.1MM 4.7 – 9.6
Sales Force Turnover Benefits Breakeven Reduction Revenue Enhancement Capital Reduction Senior Rep Retention Junior Rep Retention $0.8 – 1.6MM 0.3 – 0.6MM $3.6 – 7.3MM 1.1 – 2.3MM Total $1.1 – 2.2MM $4.7 – 9.6MM
Sales Representative Life Cycle Experienced Sales Reps Are the Largest Share of Turnover Tenure of Sales Reps Source: Total 1992 Turnover
0-3 Months Unrealistic view of the job Just a poor hiring decision 3-6 Months Need more coaching, encouragement Need more training in products and selling skills 6-12 Months Reality of selling sets in – salary ends Cold calls are difficult Want more coaching and team selling 12+ Months Believe there is better compensation elsewhere Poor compensation for high expenses Environment not conducive to professional growth Large sales can take a long time – too many lean months Sales Representative Life Cycle The Primary Reasons for Leaving Lanier Are Manageable
Sales Representative Life Cycle Though the Cost to Replace an Individual Sales Rep Is Significant . . . Tenure of Sales Reps Source: Cost of draw, benefits, hiring fees, schools, and manger time as provided by HR
Sales Representative Life Cycle Lost Sales Are 4 to 5 Times Greater Image Voice Source: Voice average sales/mo. provided by HR. Image average sales/mo. as calculated from marketing and HR Reports
Sales Representative Life Cycle A Departing Senior Reps Each Take $120-150K in Lost Sales and Investment with Them Image Voice
Sales Representative Life Cycle The Total Cost of Turnover Was $93MM in 1992 Image Voice
Reduce senior rep(over 12 months) turnover by 10 - 20% and realize a benefit of $4.4M to $8.9M in reduced cost and increased revenue Reduce junior (6 - 12 months) rep turnover by 5 - 10% and realize a benefit of $1.4M to $2.9M in reduced cost and increased revenue Consider migrating Voice's possible best practice, Sales Rep Development Team, to other areas of the company Opportunities
Sales Representative Life Cycle Each 5% Reduction in Senior Rep Turnover Can Save Lanier $2.2MM Image: 22 senior reps (10%) at $119,000 = Voice: 12 senior reps (10%) at $152,600 = $2.6MM 1.8MM OPPORTUNITY $4.4MM Image: 44 senior reps (20%) at $119,000 = Voice: 24 senior reps (20%) at $152,600 = $5.2MM 3.7MM OPPORTUNITY $8.9MM Source: In 1992, 223 senior reps left Image and 118 senior reps left Voice
Sales Representative Life Cycle Each 5% Reduction in Junior Rep Turnover Can Save XXXX $1.4MM Image: 10 Junior reps (5%) at $101,000 = Voice: 4 Junior reps (5%) at $108,000 = $1MM $0.4MM OPPORTUNITY $1.4MM Image: 20 Junior reps (10%) at $101,000 = Voice: 8 Junior reps (10%) at $108,000 = $2.0MM $0.9MM OPPORTUNITY $2.9MM Source: In 1992, 202 6-12 mo. reps left Image and 79 left Voice
Customer Service Sales Force Turnover Inventory and Distribution Collections Streamline AOP Process Benefits Summary Breakeven Reduction Revenue Enhancement Capital Reduction $9.2 – 15.9MM 1.1 – 2.1 2.0 – 2.7 $0.9 – 1.1MM 4.8 – 9.7
Reduce Expedite Cost Reduce Days-on-Hand Total Inventory and Distribution Benefits Breakeven Reduction revenue Enhancement Capital Reduction $1.0 – 1.2MM 1.0 – 1.5MM $2.0 – 2.7MM
Our Focus on Managing Inventory Dollar Levels Affects Other Parts of the Business Total World-wide Inventory Backordered lines as a percentage of all lines ordered 7% Gross Inventory 6% AOP 6/30/91 Total World-wide Inventory AOP 6/30/92 Gross Inventory Reducing inventory dollar levels at the end of the FY affects. Backorders at the beginning of the next FY.
Expedited Orders Now Constitute a Significant Proportion of Total Freight Costs $2,030,000 Expedited Shipments 17% Regular Shipments 83% $9,459,000 Total Freight Cost $11,489,000 Expedited orders increase shipment cost.
Expedited Shipments Are Growing 8% Growth $1,578,000 $1,458,000 $ 85% Growth 12% Growth $289,000 $163,000 $156,000 $145,000
The Cost of Inventory Is the Sum of Shipping Cost and Holding Costs Inventory Holding Cost Total Cost Shipping Cost If one goes up the other should go down.
But Both Inventory Costs and Expedited Shipment Costs are Going Up Total Expedited Shipments Total Worldwide Inventory 12 Month Average Days On Hand Up 6% FY 1992 Up 15% Over FY 1991 Inventory does not equate to our client's demand.
Inaccurate Demand Forecasts Cause Large Swings In Inventory Inventory Upward swings increase DOH increasing costs
A Major and National Account "Surprises" Affect Inventory Levels We can get some from Chicago, some from Harrisburg and some from Atlanta and expedite shipment! I can sell a lot of copiers to Bronx Hospital if we can ship now! Distribution Sales We don't ask national and major account sales reps for formal forecasts on new or existing accounts
Large Account "Surprises" Will Increase As Major and National Account Activity Grows Copy National and Major Account Revenue $112M $100M $85M $71M More large orders will result in more “surprises”.
FY 1992 Air Freight 2,030,000 x .50 1,015,000 Reduce Expedited Shipments by: $1,015,000 to $1,67,000 Estimated 1993 Air Freight 2,334,000 x .50 1,167,000
Voice 62,620,000 ÷ 365 172,000 x 21 to 32 3,612,000 to 5,504,000 x .11 397,000 to 605,000 Reduce Voice and Image Inventory Days on Hand 10% to 15%: $975,000 to $1,471,000 Image 137,005,000 ÷ 365 375,000 x 14 to 21 5,250,000 to 7,875,000 x .11 578,000 to 866,000 Cost of Goods Sold Value of One Days Inventory 10% to 15% of Days on Hand 8% Inventory Holding Cost 3% Value of Capital
Customer Service Sales Force Turnover Inventory and Distribution Collections Streamline AOP Process Benefits Summary Breakeven Reduction Revenue Enhancement Capital Reduction $9.5 – 15.6MM 1.1 – 2.1 2.9 – 3.4 0.0 – 0.2 $0.9 – 1.1MM 4.7 – 9.6 $1.6 – 7.5MM
Streamline Collection Process Streamline Accounts Receivable Process Reduce Accounts Receivable Collections Benefits Breakeven Reduction Revenue Enhancement Capital Reduction $0.0 – 0.1MM 0.0 – 0.2MM $1.6 – 7.5MM $0.0 – 0.3MM $1.6 – 7.5MM
Location of Collectors District Offices (50) RSSCs (4) Collection Personnel 50 68 Time Dedicated 50% 100% Effective Full-Time Collectors 25 68 Accounts Receivable ($ A/R) $ 26.4MM $ 42.7MM $ A/R per Effective Full-Time Collector $ 1.1MM $.6MM Total Number of Items 76,992 133,110 Items per Effective 3,080 1,958 Full-Time Collector “Best Practices” in Collections Suggest Large Improvements in Collection Efficiency Voice / Fax Imaging Opportunity in Imaging = 23 - 30 Resources Opportunity in Imaging = 20 - 25 Resources
Thought Processing $19.5MM xx.x% Fax 7.0MM xx.x% TOTAL $26.5MM 85.5% Voice / Fax Accounts Receivable Accounts Receivable Days Sales Outstanding Thought Processing $ 19.5MM 57 Days Fax 7.0MM 52 Days TOTAL $ 26.5MM 56 Days Opportunity to Reduce to 44 Days = $5.5MM Accounts Receivable % A/R < 31 Days Past Due Opportunity to Raise to 90% = $1.2MM Opportunity of $1.2MM - $5.5MM with cost reduction of $0.1MM - $0.2MM.
Atlanta-Orlando-BO $ 12.6MM 86.6% Chicago $ 6.0MM 86.8% Dallas / LA $ 14.2MM 87.0% Washington $ 10.0MM 86.2% TOTAL $ 42.6 MM 86.6% Imaging Accounts Receivable Accounts Receivable Days Sales Outstanding RSSCs Atlanta-Orlando-BO $ 12.6MM 47 Days Chicago $ 6.0MM 44 Days Dallas / LA $ 14.2MM 44 Days Washington $ 10.0MM 50 Days TOTAL $ 42.6 MM 46 Days DSO Reduction Opportunity = $2.0MM % A/R < 31 Days Past Due Accounts Receivable RSSCs A/R Reduction Opportunity = $1.4MM Opportunity of $1.4MM - $2.0MM with cost reduction of $0.1MM.
Collection Processes - Cost Reduction $ 1,000K - $1,500K Accounts Receivable - Cost Reduction $ 400K - $1,000K Cost Reduction Opportunity $ 1,400K - $2500K Accounts Receivable - Cash Flow Improvement $ 1,600K - $7,500K Cumulative Results Identify a Large Opportunity in Collections Measurement Range of Opportunity
Days Sales Outstanding 44 Days % A/R Current or 1 - 30 Days Past Due 90% “Best Practices” in Accounts Receivable Point toCost Savings and Capital Reductions Best Practices Measurement Goal
Customer Service Sales Force Turnover Inventory and Distribution Collections Streamline AOP Process Benefits Summary Breakeven Reduction revenue Enhancement Capital Reduction $1.6 – 7.5MM $9.5 – 15.6MM 1.1 – 2.1 2.9 – 3.4 0.0 – 0.2 1.4 – 1.8 $0.9 – 1.1MM 4.7 – 9.6
AOP Budget/Planning Process The Budget / Planning Activities Are One of the Most Important Company Activities Time Strategic Objectives Energy Deliver a Message To the Market Budget / Planning Opportunity Passed-Up Scorecard