Download
1 / 36
360 likes | 369 Views
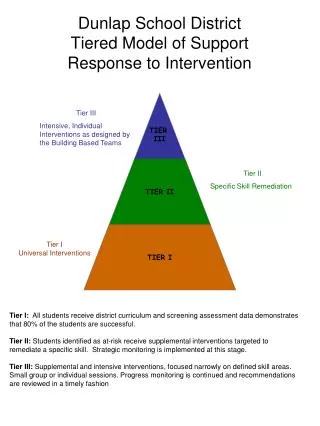
IT Support of the Active Intervention Model. The Fourth Annual Disease Management Summit Jefferson Medical College June 29, 2004. The evolution of population health improvement. Behavioral Risk Factors. Clinical Risk Factors. Chronic. CHF. 1998-2002. Current. Our Path. 1994-98.

E N D
IT Support of theActive Intervention Model The Fourth Annual Disease Management Summit Jefferson Medical College June 29, 2004
The evolution of population health improvement Behavioral Risk Factors Clinical Risk Factors Chronic CHF 1998-2002 Current Our Path 1994-98 Highest ROI Lower ROI Moderate Total $$ Impacted Larger Total $$ Impacted 2
People with chronic conditions only receive 56.1% of recommended care* Only 24% of people with diabetes received three or more HbA1c tests in a two year period Only 45% of people presenting with an MI received beta-blockers We’re no longer dealing with the low hanging fruit *McGlynn, Asch et al, The Quality of Health Care Delivered to Adults in the US NEJM 2003; 348:2635-48 3
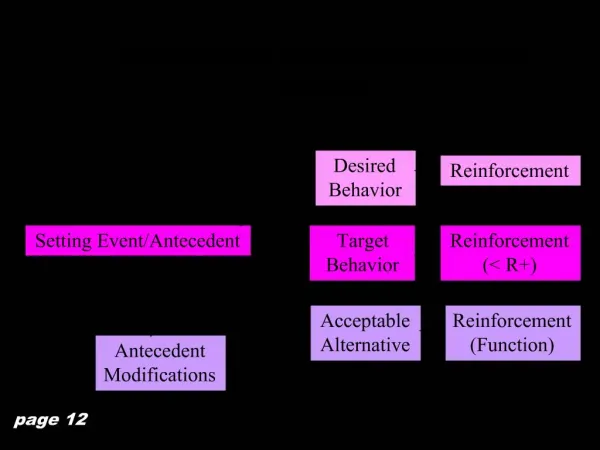
The days of low hanging fruit CHF 1994-98 • Rudimentary Data Systems • Basic claims-based algorithms and MD referrals to ID and stratify • Standardized content for education and coaching • Faxes, telephones, pagers to communicate with pts. and MDs • Static workflow engine to facilitate QA and RN efficiency • Collection and analysis of pt. reported data for monitoring, alerting, and reporting 4
The introduction of multiple condition and true co-morbidity management Chronic CHF 1994-98 1998-2002 Current • More Advanced Data Systems • Refinement of ID algorithms to minimize false positives and negatives – still just claims based • Regression models for stratification • More customized content to deal with co-morbidities • Internet, faxes, telephones, pagers to communicate with pts. and MDs • Dynamic workflow engine to prioritize based on condition severity • Collection and analysis of pt. reported data, connected biometric devices, and some chronic disease related claims data for monitoring, alerting, reporting 5
Dealing with gaps between recommended and actual care Clinical Risk Factors Chronic CHF 1994-98 1998-2002 Current • Intelligent Data Systems • Aggregation and analysis of multiple data feeds for ID and initial stratification • Predictive modeling to ID and profile (individual stratification) • Individualized content to focus on each pt’s. risk factors • Internet, faxes, telephones, pagers to provide secure, remote access for pts., MDs, case managers, and customers • Data driven workflow engine to prioritize tasks based on potential ROI • Real time EDI to monitor, alert, track progress, update risk factors and profiles, identify new prospects 6
The Holy Grail: Changing behavior to prevent disease Behavioral Risk Factors Clinical Risk Factors Chronic CHF 1994-98 Our Future 1998-2002 Current • Interactive Data Systems • All of the above plus more real time two way remote interaction between pts., disease managers, and MDs (e.g. interactive TV, implantable devices, PDAs, cell phones, other wireless technologies) 7
The Active Intervention Model:Enhancing ROI through targeted risk factor management • Make the most efficient use of resources to minimize intervention cost • Devote resources toward the people who are going to deliver the highest ROI – intervene with the right people • Target every interaction toward changing things that will contribute to a positive ROI – focus on the right things • Increase the probability of sustained behavior change to optimize outcomes • Build a trusting relationship between the disease manager and the participant to enhance engagement • Make every interaction relevant to the participant and/or his or her physician - to enhance adherence • Focus on measurable things – to provide positive feedback to reinforce positive behavior change 8
Minimizing intervention cost • Find and intervene with the right people • Predictively model people most likely to benefit • Prioritize participants by potential ROI rather than severity • Ensure ongoing surveillance to identify people with gaps in care • Focus on the right things • Prioritize activities by potential ROI • Ensure appropriate ongoing surveillance to detect modifiable risk factors • Modify intervention (up or down) as health status changes 9
Optimizing outcomes • Short term - Detect and avoid emerging exacerbations • Start with near term high risk prospects • Actively monitor symptoms, behaviors, gaps in care, and vital signs • Educate, support, and coach to modify unhealthy behaviors • Alert MDs to clinical changes in health status • Reinforce adherence to the treatment plan • Long term - Slow disease progression • Design an appropriate intervention for everyone in the target population • Focus on closing the gaps in the standard of care • Promote clinical guideline adherence • Promote sustained behavior change 10
This approach was outlined by the Institutes of Medicine Establish and maintain a comprehensive program aimed at making scientific evidence more useful and accessible to clinicians and patients* • Ongoing analysis and synthesis of the medical evidence • Delineation of specific practice guidelines • Identification of best practices in the design of care processes • Enhanced dissemination efforts to communicate evidence and guidelines to the general public and professional communities • Development of decision support tools to assist clinicians and patients in applying the evidence • Establishment of goals for improvement in care processes and outcomes • Development of quality measures for priority conditions Crossing the Quality Chasm: A New Health System for the 21st CenturyNational Academy Press, July 2001 *IOM Recommendation 8 11
There’s too much information • The lag between the discovery of more efficacious forms of treatment and their incorporation into routine patient care is in the range of 15 to 20 years* • Traditional method of dissemination has proven ineffective • Search for relevant information – widely scattered & with wide variation in quality • Evaluate the evidence for validity and usefulness – advanced study in evaluation is required • Implement the appropriate findings – Demands and rigors of clinical practice do not permit regular application of this process *Balas and Boren, 2000 (Quoted in the IOM Report) 12
And many challenges to incorporate it into MD and pt. decision making • Integrating fragmented clinical and administrative data • Integrating fragmented and duplicative healthcare delivery • Maximizing efficiency of disease management staff without compromising the quality of relationships • Engaging and motivating patients (particularly those who are at risk and asymptomatic) • Implementing biometric monitoring cost effectively • Increasing patient adherence to biometric monitoring • Increasing physician acceptance of best practice reinforcement • Integrating multiple medical management efforts 13
IT can help us overcome these challenges • Redesign care processes based on best practices • Effectively use information technologies to improve access to clinical information and support clinical decision making • Manage the growing knowledge base and facilitate changes in required skills • Develop effective teams to interact with the patient • Coordinate care across patient conditions, services, and settings over time • Incorporate performance and outcome measurements for improvement and accountability Crossing the Quality Chasm: A New Health System for the 21st CenturyNational Academy Press, July 2001 14
Disease Management IT Tools • Data collection and analysis • Claims • Administrative • Self report • Automated biometric • Clinical • RN interactions • Predictive modeling and profiling • Clinical indicator gap analysis • Workflow prioritization • Pt engagement • MD engagement • Integration/EDI 15
Profiling:The Active Intervention Model Continuously collect and analyze all available relevant data about the people in the target population Identify and score each individual in the population based on how their clinical, healthcare utilization, and psychosocial risk factors compare with the evidence-based standard of care (i.e., how large is the gap?) DM clinical staff works with a profile of each program participant including a rank ordered “problem list” to help them focus on the issues most likely to have a near term positive impact on the participant’s health Alerts the participant’s personal physician of actionable changes in their patient’s condition Constantly updates the individual program participant’s score based on information we receive on progress they’ve made or new problems they encounter 16
The IT to support AIM • Categorizes, assigns value to, and prioritizes major cost drivers and best practices based on an extensive review of evidence-based best practices, clinical literature, and claims analysis • Rank orders clinical indicators by their contribution to cost and quality • Develops an individual profile and score for each program prospect based on the identified gaps in the standard of care • Develops a prioritized action plan to help disease managers work with participants to close the gaps • Creates alerts to send to the participants’ MDs or disease managers based on identified urgent gaps • Provides appropriate content for teaching, support, and coaching 17
A model like this:Organization and prioritization of vast amounts of data 18
Each disease (and individual) has a profile of what drives cost Musculoskeletal Cardiovascular Disease Injury & Poisoning Infections Gastrointestinal Diabetes General Symptoms Heart Failure Kidney Disease Blood Disorders Respiratory 20
The Theory: Let the the cost drivers and clinical indicators dictate selection and intervention • Review the clinical literature to determine the evidence-based best practices and targeted clinical indicator values • Identify relevant clinical symptoms, laboratory values, utilization parameters, practice guidelines, and psychosocial factors that are driving costs • Develop a system of prioritization to rank order clinical indicators by their contribution to cost and quality • Develop a scoring system which profiles each participant based on the identified gaps in the standard of care • Develop sets of actions that disease managers can take to work with participants and their physicians to close the gaps • Develop content to support the disease managers in those efforts 21
A system of indicators and values determine the immediacy, intensity, and type of intervention Intervention Intensity Immediacy 22
Prioritize indicators to guide the disease manager’s work in closing the gaps in evidence-based care 24
Minimize the time spent collecting data and allow for an exclusive focus on things that will have an impact on ROI 25
And provide the opportunity for very specific praise and feedback to promote behavior change 26
The combination of triggers and values drives an individualized Member Action Plan (MAP) The MAP is designed to address those factors that the disease manager can affect the fastest and that can have the largest impact on the participant’s health. 27
The workflow engine can then push targeted actions and content to the disease manager 28
The power of technology • Every single program participant gets his or her own individual disease management intervention • For example, with CHF (not taking co-morbidities into account) there are more than a trillion possible individual data driven programs given the number of indicators and different severity levels (30 indicators with an average of 4 severity levels each) 29
To engage physicians, communicate actionable gaps or exacerbations to them in real time Participant Demographic Information Medications Vital Sign Information Comorbidity Tracking Nursing Note MD f/u 30
Communicate evidence-based best practice in real-time rather than in a binder Provided when the MD needs the info most Based on up to date Evidence-based Guidelines A variety of options can be provided leaving decision making to MD while reinforcing best practice 31
Provide case managers and MDs with real time access to participant information 32
Provide participants with easy access to disease managers and selfcare content 33
Clinical indicator & risk factor focus enables the vision of the Institutes of Medicine… 34
Traditional Disease Management Data Driven Disease Management Information driven individualized population health improvement 35
IT Support of theActive Intervention Model The Fourth Annual Disease Management Summit Jefferson Medical College June 29, 2004