Download
1 / 55
550 likes | 558 Views
Climate Change in the Distant Past Shows Our Path to Our Hot Future. Dr. Gene R. H. Fry 24 March, 2018 updated. Trouble in India. Polluted air cuts 3.4 years off Indian lives, 6 in cities from New Delhi to Kolkata. Heat stroke deaths mount. Ground Water Loss.

E N D
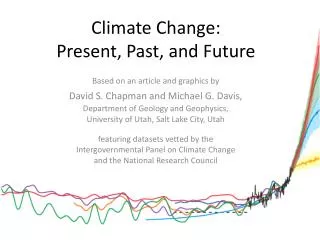
Climate Change in the Distant Past Shows OurPath to Our Hot Future Dr. Gene R. H. Fry 24 March, 2018 updated
Polluted air cuts 3.4 years off Indian lives, 6 in cities from New Delhi to Kolkata. Heat stroke deaths mount. Ground Water Loss TheGanges Basin loses enough ground water yearly to fill 10% of Lake Erie. Most mountain glaciers dwindle ever faster in the east & central Himalayas. When they vanish, so could the Ganges River (& others) in the dry season. Many wells in China & India wheat belts go down 300 meters for water. With more CO2, 2ºC warming cut yields 8-38% for irrigated wheat in India. Kumar ’11 Monsoonrain declined by as much as 10-20% in N & C-E India, 1901 to 2012. Koll ’15 Phytoplankton declined 30% in the Indian Ocean since 1999, or 20% since 1950. Koll ’16 Unchecked, warming by 2100 will cost India 8.7% of GNP. Asia Development Bank ‘14
Antarctica was mostly ice-free, at 7ºC warmer than now. Temperatures can rise “suddenly”. million years ago With more ice, temperature swings are wider, since albedo changes - from icy to less icy - are larger. Earth’s surface can grow far warmer than now.
CO2 Levels in the Air , • Up 45% highest level since 14-15 million years ago (430-465 ppm) The deep ocean then was ~5.6ºC warmer. Annual Averages Seas then were 25-40 meters higher. Tripati ‘09 CO2 levels were almost as high (357-405 ppm) 4.0 to 4.2 million years ago. Sea surfaces then were ~ 4ºC warmer. (38% Since 1880) Seas then were 20-35 meters higher. Csank ‘11, Dwyer ‘08 This means ice then was gone from almost all of Greenland, most of West Antarctica, and some of East Antarctica. So is 1/3 in the East. 2/3 of West Antarctic ice is grounded below sea level. Sediments show East Antarctic ice then retreated 100s of km inland. Cook ’13 (CH4 up 111% since 1880) 300 ppm (maximum between ice ages) Vostok ice cores suggest a 4.5ºC warmer world at 400 ppm. 4.5ºC warmer world makes dry Kansas summers hotter than Las Vegas ones now. We face BIG lag effects. Current CO2 levels are already too high for us.
+ 2015 CH4level ~ 1836 ppb Vostok Ice Core Data . Vostok Ice Core Data + 2015CO2level ~ 400 ppm ∆ + 2015 Vimeux, Cuffey & Jouzel, Earth and Planetary Science Letters 203: 829-843 (2002) Thousand Years before Present ppm = parts per million ppb = parts per billion
Lessons for Our Future from Ages Ago For the ratio of the global average ∆ºC to Vostok ∆ºC, I use 0.6, the ratio of global change to polar, over the last 2 million years, from Snyder (2016). With current CO2 & CH4levels,theequations yield global surface warming of 7.8ºC, but only 4.5ºC if CH4 is neglected. Warming how fast? 40-50% in decades, the rest over centuries. 9.0 7.2 5.4 3.6 1.8 0 -1.8 -3.6 -5.4 (10 K year resolution) 14.1 - 14.5 Mya R2 for Vostok 4.0 - 4.2 Mya .846 .733 Est. Global∆ºCfrom 1951-80 400 ppm in 2015 0 - .420 Million years ago Estimating ∆ºC at Vostok -107 + 19.1 * LN (CO2) -110.7 + 11.23 * LN (CO2)+ 7.504 * LN (CH4) CH4 today ~1840ppb ppb CH4 384 461 554 Vostok typical ppb CH4 for ppm CO2: 2.13 x
Global Surface ∆°C = 0.6 * (-110.7 + 11.23 * LN (CO2)+ 7.504 * LN (CH4)) +2ºC globally requires (for example) 323 ppm CO2 and 700 ppb CH4. This means stopping emissions and removing 2/3 of the CO2 that humans have emitted + whatever we emit in years to come and all of the CH4. Humanity’s remaining carbon budget for burning fossil fuels is NEGATIVE250+ GTofcarbon.
• • Of the net energy Earth absorbs from the Sun, ~84% went to heat oceans to 700 meters deep. 7% melted ice, 5% heated soil, rocks & trees, while only 4% heated the air. Levitus, 2005 I 1967-1990 +0.4 x 10²² Joules / year 1022 Joules = 100 yearsof US energy use, at 2000-13 rate 1991-2005 +0.7 / 2006-2016 +1.0 / = 17 x human use Heat Content (1022 Joules) acceleration By now, the oceans gain more heat every 2 years than ALL the energy we’ve ever used. IMMENSE heat gain But much of ocean heat gain has gone below 700 meters deep, to 2,000 meters deep. Now we see: ~93% went to heat oceans, less to air and others. Ocean Heat Content .
Near-land-surface air has warmed 40-100% faster than sea surfaces. +1.2ºC in 100 years NASA, 5-year moving average The 1997-2017 rate of change is At that rate, “Both” will pass 2ºC above 1880 levels in 2063. 2.5ºC / 100 years for Land, 2.0 for Sea, “Land” in 2037. 2.2 for Both.
40% of warming since 1975 has come from albedo (reflectivity) changes –direct and indirect. Warming to 2100 and beyond will be dominated by albedo changes and permafrost emissions. How do albedo effects produce that much warming?
even if we stop emitting now. Blame Earth will warm 3 x more, phasing out coal’s sulfur emissions (about 0.3ºC), vanishing Arctic sea ice (~0.3ºC), receding northern snow cover (~0.3ºC), receding Greenland & Antarctic ice (~0.2ºC), warming oceans enough so energy out = in (~0.6ºC), more H2O vapor & less cloud cover(1.85 multiplier), & carbon emissions from permafrost, etc. (~1ºC). More carbon emissions can add up to 1-2ºCeach from H2O vapor, clouds & permafrost.
When? (How fast?) Sulfur and sea ice loss (Mar-Nov) will be complete about 2050. Snow cover and cloud cover losses will continue. Permafrost + emissions ramp up in an S-curve thru 2300. Polar land ice loss and warming deep oceans span centuries.
Earth Is Heating Up. • Earth now absorbs 0.25%more energy than it emits: a 300(±75)million MWheat gain =50 x global electric supply. This absorption has been accelerating, from near zero in 1960. Earth’s surface must warm another 0.6ºC . so it emits enough heat to balance absorption. The oceans have gained ~ 10 x more heat in 40 years than all the energy humans have EVER used. (Hansen ’11)
Sulfate Cooling Radiation Forcings IPCC AR5 . Figure TS.7: IPCC, AR5 (2013) Sulfates offset (.41+.41/(.41+.29)*(0.10+.45)-.01=.72)/(sum of above = 2.30) = 31% of GHG warming.
Sulfate Cooling Un-Smooths GHG Warming sulfates still 3 x 1880 levels NASA adjusted R2 = 97.8%. Pinatubo human sulfur emissions down 23% from 1979 peak Coal-Fired Power Plants +1.8ºC Sulfatesup 110%. major cooling Agung US SO2 cuts start. more SO2 Katmai + cool Santa Maria+ warm Great Depression Krakatoa less SO2 up the stacks warm Predicted ∆°C = -20.51 + 2.223 * LN (CO2 ppm) + 1.133 * LN (CH4 ppb) - .00319 * SO4 ppb CO2, CH4 & SO4(5-year µ’s (SO4 est. from emissions, lagged 1 year)) have t-ratios of 9.72, 11.61 and -11.36). SO4 data includes industrial, occasional large volcanic, and other natural emissions. Averages: 80 (100 now) 8 (episodic) 30
From 1982 thru 2013, radiative forcing from northern snow cover decreased by 0.33 W / sq m / ºC, adding 12% to GHG warming. Chen ‘16 Snow Observations, 1965-2012 State of the Climate in 2012, American Meteorological Organization
Greenland & Antarctic Ice . Andrew Shepherd et al., “A Reconciled Estimate of Ice-Sheet Mass Balance”, Science 38(6111):1183-1189. Nov. 30, 2012
Clouds reflect ~17.5% of incoming sunlight (~ 59 W/m2) = 10 W/m2. Annual Average Cloud Observations, 1982-2012 State of the Climate in 2012, American Meteorological Organization mean of 5 data sets, including ISCCP
Clouds by Altitude Global Monthly Cloud Cover Low less cooling clouds Middle Cloud Cover (%) High less warming clouds more warming clouds International Satellite Cloud Climatology Project 1984 1988 1992 1996 2000 2004 2008 dashed lines by Gene Fry net warming effect. Magnitude?
Zelinka ‘17 Cloud changes from 1°C warming add ~16% to warming otherwise.
Water Vapor’s GHG Effect 1°C warmer air contains 7% more H2O vapor, on average. That increases radiative forcing by 1.45 W/m2. That is 86% as much as from CO2 emitted since 1750.
MacDougall 2012 Permafrost contains ≥ 2 x the carbon in the atmosphere.
Thousand Years before Present The record across several ice ages, at times colder than now, suggests sea level changes of 14 to 24 meters per °C change at the global surface. The record for times warmer than now, 4 and 14 million years ago, suggests 6 to 7 meters of sea level rise per °C of global surface warming. How fast might seas rise in coming centuries?
Sea Levels over Last 24,000 Years 3 meters per century during Meltwater Pulse 1A (1 millennium) 1.5 meters per century from 15 to 8 millennia ago Warming is 40-50 times as fast as then, but only 1/3 as much ice is left.
Scenarios on the next 4 slides spread ocean warming over 1,000 years. They use the previous 15 slides for permafrost emissions; sea level; and water vapor & albedo effects of reduced sulfates, snow, ice, and clouds. For clouds, 60% of the amount from AMO 2013 is used. Cloud changes are complex and explain part of warming to date. The effect of Arctic sea ice loss from Hudson (2011) is used: globally, 0.7 W / sq meter for total loss, during the daylight season, of which 0.1 had already occurred. Permafrost carbon emission trajectories in the scenarios are based on work by MacDougall et al. (2012). But permafrost has twice the carbon he modeled, and albedo changes will warm permafrost faster than he modeled. So, in the case of fossil fuel phase-out by 2050, and especially the base case (peak ~ 2014, but zero only after 2100), permafrost emissions exceed those shown by MacDougall. In the carbon sequester case, they are lower.
Pathways for Combined Effects
2100 CO2 Emissions Past & Future . Soil carbon loss since 10,000 BC = 60% of fossil fuel emissions to 2010. Lal 2001 2014 peak CO2 removal = 32% of fossil fuel CO2 emissions to 2010.
2100 Future CO2 ppm . Permafrost carbon emissions included: +ppm CO2 21002300 Base 57 +185 x FF 2050 53 +109 Remove CO2 30 + 27 Cold Turkey 41 + 56
2100 Future ∆°C . Kansas becomes as hot as Las Vegas now. includes big albedo effects: loss of sulfates; sea ice; some cloud cover, snow & land ice. More H2O in the air. international target
2100 2100 2014 peak Future Scenarios . Soil carbon loss since 10,000 BC = 60% of fossil fuel emissions. Lal ‘01 Kansas becomes as hotas Las Vegas now. includes big albedoeffects: loss of sulfates; sea ice; some cloud cover, snow & land ice. Also more H2O in air. international target CO2 removal = 32% of fossil fuel CO2 emissions to 2010. Permafrost carbon emissions included: +ppm CO221002300 Base 57 + 185 x FF 2050 53 + 109 Remove CO2 30 + 27 includes thermal expansion & near total ice loss (x CO2 Removal) from most glaciers except Greenland (less in xFF 2050) & E. Antarctica, where % loss is modest.
Combined Effects on Things We Care about
2ºvs 4° Warming . 1.2ºC warming is here. 2ºC warming is unavoidable, absent MASSIVE CO2 removal. Holding warming to 2ºC, not 4º, prevents these losses: Gross World Product . 1/5 of theWorld’s Food . 2/3 of the Amazon Rainforest 1/8 of the world’s oxygen supply Gulf Stream + West Antarctic Icecap . Florida & Louisiana, central CA, Long Island, Cape Cod 1/2 ofall Species . 4ºCwarming threatens civilization itself. Details to follow: first 2ºC, next 3ºC, then 4ºC, finally 5ºC. Emissions continue. 3+ºC more is in the pipeline. - Norfolk area, much of 5ºCisworse.
2ºC Warming. . Stern Review, British government, Oct. 2006 . (a report by dozens of scientists, headed by the World Bank’s chief economist) . selected effects - unavoidable damages, absent MASSIVE CO2 removal ASAP . Typhooncosts double. Major heat waves are common. Droughts intensify. Civil wars & border wars over water increase: Crop yieldsrisenowhere e.g.,Brazilsoyyields fall 30-70%, wheat 50%, corn 60%. World Bank 2014 Greenlandicecapcollapsebecomes irreversible. If we play it right, melting takes 3,000 years. The ocean begins its invasion of Bangladesh. It lasts for centuries. We choose now how fast and how far. * includes CH4, SO4, soot, O3, N2O, CFCs Many more major floods Forestfires worsen. Deserts spread. more Darfur’s. CNA Corp. – 11 retired US Generals & Admirals, April 2007 & fall in the tropics. If we play it wrong, 300 years.
3ºC Warming additional damages – may be delayed or avoided with MASSIVE CO2 removal. Droughts & typhoonsget much worse. Hydropower and irrigation decline. Crop yieldsfallsubstantiallyin many areas. More water wars & failed states. 2/3ofAmazonrainforestmayturntosavanna,desertscrub. Tropical diseases (malaria, etc.) spread farther and faster. 15-50%of species face extinction. Stern Review & CNA Corp. Water is scarce. Terrorists multiply. Deforestation drove São Paulo drought. Nobre ‘14 Cox ‘00, Huntingford ‘08, Jones ‘09, Cook ‘10 Lyme disease, West Nile virus, dengue fever too. Etc. Mammal extinction rates are already 200-500 x background rates.
.4ºC Warming further damages - avoidable • Water shortages afflict almost all people. CropyieldsfallinALLregions, by1/3inmany. Entire regions ceaseagriculturealtogether, Water wars, refugee crises & terrorism become intense. This has begun: Somalia, Darfur, Rwanda, south Sudan, Mali, north Nigeria, Syria, Iraq. Methane releasefrom permafrost accelerates more. The Gulf Stream may stop, monsoons sometimes fail. “Gulf Stream” is shorthand for the world ocean thermohaline circulation, to which it’s connected. West Antarctic ice sheet collapse speeds up. Goodbye to Miami, New Orleans, Norfolk & Venice by 2100, to Amsterdam, Bangkok, Canton, Kolkata, Saigon, Shanghai & Tampa by 2200. Goodbye also to parts of New York, London & Washington, as seas creep higher. • At times in US SE, it’s too hot & humid to survive outside work long. Stouffer ’13, Sommer ‘14, Kopp ’15 . Stern Review & CNA e.g., Australia. We played it wrong.
5°C Warming . 5ºCWarming Deserts GROW by 2 x the size of the US. World food falls by 1/3 to 1/2. Human population falls to match the reduced food supply. Other species fare worse. Rind ‘90 a lot,
Solutions Stop putting carbon in the air. Take carbon out of the air, big time. Maybe screen out sunshine too, temporarily.
Policy Tax carbonacross fossil fuels, worldwide, in proportion to carbon content. Impose the tax upstream (wellhead, mine mouth, port). It should start low, but then rise substantially and briskly, on a pre-set trajectory. End subsidies for production and use of fossil fuels. Give carbon tax creditsfor carbon removalfrom ambient air, at the same rate carbon emissions are taxed. US$40 / tonne of carbon ($10 / ton CO2), rising 12% / year. Return net proceeds as equal tax credits to individuals. This creates jobs and grows GDP, compared to no carbon tax.
Positive Signs Europe’s 6 oil majors have called for a worldwide carbon price. Big Oil already uses shadow CO2 prices of $9-80 / ton. 32 top US economists called for a carbon tax, as did ExxonMobil in Feb 2017. So have leading Republicans Tillerson, Baker, Schultz, Paulson, Walton. Many US companies asked Trump to stay in the Paris climate pact: the 3 largest by $ value,the largest by revenue, 4 of 5 biggest oil majors and many others. Over 100 US firms will go 100% renewable: WalMart, Apple, Google, etc. Worldwide, newnon-carbon power was 150% of new carbon power in 2015. Solar power is now cheaper than coal power in India. India’s 2016 plan has no new coal power plants to 2027, and 57% renewable power by then, vs 70% from coal now.
CO2 Emissionsfrom Fossil Fuels CO2 Emissions by Nation, Year . (Billion Metric Tons) USDoE / EIA China Misc. Asia =. Korea, Indonesia, Thailand, Bangladesh, Taiwan, Philippines, Malaysia, Vietnam, etc. In 1992, Ukraine etc. to Europe, Kazakhstan, etc. to Central Asia. Mid-East & Central Asia Other Asia Misc. Asia India US Japan Europe M-E & CA= Turkey to Pakistan & Kazakhstan, led by Iran & S Arabia USSR Other Russia Latin America 1-Yr %∆ 2009 8.3 2010 7.3 2011 10.2 2012 2.9 2013 -0.8 2014 -1.5 2015 -1.6 1-Yr %∆ 2009-0.5 2010 5.4 2011 3.8 2012 1.0 2013 -1.0 2014 -1.1 2015 -0.8 Africa China Canada Oceania = Australia, NZ, Pacif. World
America’s Low-Carbon Revolution Has Begun US DOE / EIA (2017 – 12 mo) US DOE / EIA (2017 – 12 mo) Hydro Wind Oil 2017 was lowest since 1992, 14% below peak. Solar US DOE / EIA (2017 – 12 mo)
Solutions - Electricity •Price it right Coal: To follow load, store energy in car batteries, trailer & flow batteries, water uphill,compressed air, flywheels, molten salt,hydrogen. Wind- Resource is many x total use. It’s growing fast. it’s usually cheaper (2-8¢/kWh) than coal. Solar -Resource dwarfs total use. PV costs 3-20 ¢/kWh, thermal (with flat mirrors) 10¢. For off-grid Africa, India? 45¢ / day PV panel, battery, 2 LEDs, cellphone charger, radio. Water, Wood, Waste - Rivers will dwindle. More forestfires limit growth. retail, for everyone: low at night, high by day, highest on hot afternoons. Use less. Scrub out the CO2 with oxyfuel or pre-/post-combustion process. Output peaks near when cooling needs peak.
Solutions -Efficient Buildings + At Home - Use heat pumps. Better lights -compact fluorescents(CFLs) & LEDs. Efficientappliances Insulation- high R-value inwalls & ceiling, Low flow showerheads, microwave ovens,trees,awnings, clotheslines,solar roofs Commercial - Use micro cogeneration, heat pumps. Don’t over-light. Use LCDEnergy Starcomputers. Usefree cooling (open intakes to night air),green roofs,solar roofs. Make ice at night. Melt it during the day Industrial - Energy $ impact the bottom line. Efficiency is generally good already. Case-specific process changes as energy prices rise. Turn off un-used lights. • - air conditioners, refrigerators, front load clothes washers honeycomb windowshades,caulking Use day-lighting,occupancy sensors, reflectors. Ventilate more withVariable Speed Drives. - for cold water to cool buildings. Check % IRRs. Facilityenergy managersdo their jobs. Use morecogeneration.