Download
1 / 20
200 likes | 332 Views
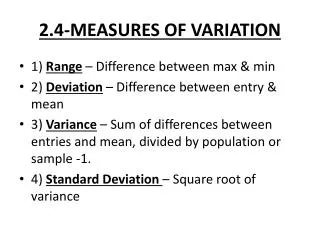
SUMMARIZING DATA: Measures of variation.

E N D
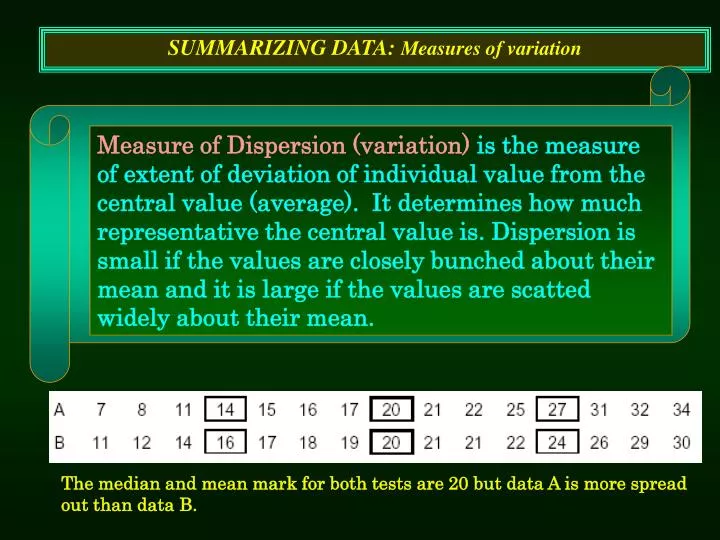
SUMMARIZING DATA: Measures of variation Measure of Dispersion (variation) is the measure of extent of deviation of individual value from the central value (average). It determines how much representative the central value is. Dispersion is small if the values are closely bunched about their mean and it is large if the values are scatted widely about their mean. The median and mean mark for both tests are 20 but data A is more spread out than data B.
Important measures of dispersion are: • Range • Variance & standard deviation • Standard error of Mean • Co-efficient of variation.
Range Range is the absolute difference between the highest value and the lowest value in a series of observations. Range = largest value - smallest value Example: the weight of 10 students are: 25, 28, 33, 36, 40, 45, 49, 52, 55, 57. Range is 57 – 25 = 32. • The range is the simplest measure of dispersion. • It is a rough measure of dispersion as its measure depends upon the extreme items and not on all the items. • It does not tell us anything about the distribution of values in the series.
Range Application: • Range is used in medical science to define the normal limits of biological characteristics. • Example:normal ranges of systolic and diastolic blood pressure are 100 – 140 mm and 80 –90 mm respectively. Ordinarily observations falling within a particular range are considered normal and those falling outside the normal range are considered as abnormal. • Range for a biological character such as blood cholesterol, fasting blood sugar, hemoglobin, bilirubin etc is worked out after measuring the characteristics in large number of healthy persons of the same age, sex, class etc.
Range • Merits: • It is simple to compute and understand. • It gives a rough but quick answer • Limitation: • It is not a satisfactory measure as it is based only on two extreme values, ignoring the distribution of all other observations within the extremes. These extreme values vary from study to study, depending upon the size and nature of sample and type of study.
Variance & Standard deviation • Karl Pearson introduced the concept of Standard Deviation in 1893. • The standard deviation is a statistic that tells us how tightly all the values are clustered around the mean in a set of data. The mean of the squares of the deviations of every observation from their mean is a measure of spread and is called the variance. The standard deviation is the square root of the variance. It is computed as the root of average squared deviation of each number from its mean. For example, for the numbers 1, 2, and 3 the mean is 2 and the standard deviation is: SD = 0.667 = 0.44
Standard deviation • Merits: • It is the most important and widely used measure of dispersion. • It is based on all the observations and the actual sign of deviations are used. • Standard deviation provides the unit of measurement for the normal distribution. • It is the basis for measuring the coefficient of correlation, sampling and statistical inference. • Limitation: • It is not easy to understand and difficult to calculate • It is affected by the value of every item in the series.
Calculations of SD: = 20 = 20 In these two groups, means are same (20) but their variation (SD) is different (SDA, 8.2 and SDB, 5.5).
Greater SD, greater is variation of observation. Mean is presented with SD as ….. Mean±SD.
Standard Error of Mean The standard error of a sample mean is just the sample standard deviation divided by the square root of the sample size. If we draw a series of samples fro same population and calculate the mean of the observations in each, we have a series of means. The series of means, like the series of observations in each sample, has a standard deviation. The SE of the mean of one sample is an estimate of the SD that would be obtained from the means of a large number of samples drawn from the population. Another thing is if we draw random samples from the population their means will vary from one to another. This variation depends on the variation of population and size of samples. We do not know the variation of population so we use the variation of the sample as an estimate of it. This is expressed in SD and if we divide SD by squire root of the number of observations in the sample we have an estimate of SE of mean, SEM = SD/n
Advantageof SE • To determine the significant difference of two means of different variables. • To calculate the size of sample. If SD is known. • =
Greater SE, greater is variation of observation. Mean is presented with SE as ….. Mean±SE.
Co-efficient of variation (C.V.) Relative measure of variation is called Co-efficient of variation (C.V.). C.V. is defined as the S.D. divided by the mean times 100. It is useful in comparing distribution whose units or characters may be different e.g. height in cm in one and in inches in the other.
Co-efficient of variation (C.V.) Example: Height (cm) of adult and children are given in the table Mean SD CV Adult 160 cm 10 cm 6.25% Children 60 cm 5 cm 8.33% It means though height in adult shows greater variation in SD, but real thing is that children is greater variation.
Population & Sample • Population • All possible values of a variable or all possible objects whose characteristics are of interest in any particular investigation or enquiry. • If the income of the citizen of country is of interest to us, the aggregate of all relevant incomes will constitute the population. • Sample • A sample is a part of population. • Although we are primarily interested in the properties of a population or universe, it is often impracticable or even impossible to study the entire universe. • Thus inferences about a population are usually drawn on the basis of a sample. It represents the population.
Normal Distribution • The normal distribution was first introduced by the French mathematician La Place (1749-1827). • It is highly useful in the field of statistics. The graph of this distribution is called normal curve or bell-shaped curve. • In normal distribution, observations are more clusters around the mean. Normally almost half the observations lie above and half below the mean and all observations are symmetrically distributed on each side of the mean. • The normal distribution is symmetrical around a single peak so that mean median and mode will coincide. It is such a well-defined and simple shape, a great deal is known about it. The mean and standard deviation are the only two values we need to know o be able to describe a normal curve completely.
Normal Distribution • Characteristics : • The curve is symmetrical • It is a bell shaped curve. • Maximum values at the center and decrease to zero symmetrically on each side • Mean, median and mode coincide • Mean = Median = Mode • It is determined by mean and standard deviation. • Mean1SD limits, includes - 68% of all observations • Mean 2SD - ,, ,, - 95% ,, ,, • Mean 3SD - ,, ,, - 99% ,, ,,
Normal Distribution • Almost all statistical tests (t-test, ANOVA etc) assume normal distributions. Fortunately, these tests work very well even if the distribution is only approximately normally distributed. • Some tests (Mann-whitney U test, Wilcoxon W test etc) work well even with very wide deviations from normality.