Download
1 / 9
130 likes | 611 Views
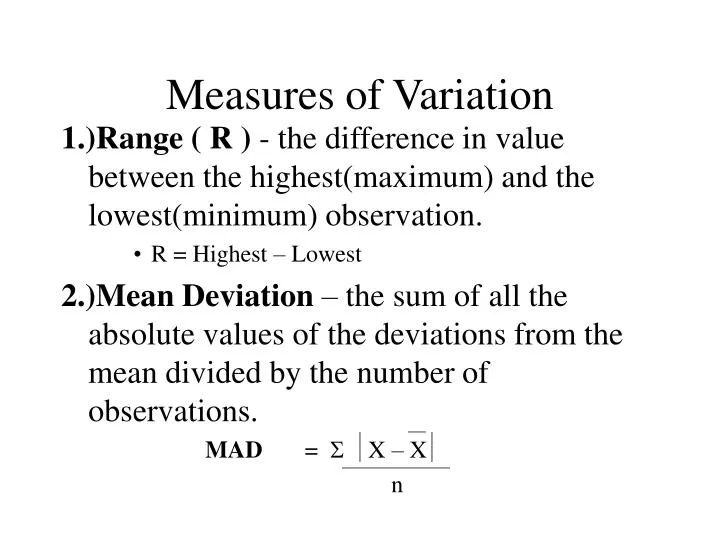
Measures of Variation. 1.)Range ( R ) - the difference in value between the highest(maximum) and the lowest(minimum) observation. R = Highest – Lowest 2.)Mean Deviation – the sum of all the absolute values of the deviations from the mean divided by the number of observations.

E N D
Measures of Variation 1.)Range ( R ) - the difference in value between the highest(maximum) and the lowest(minimum) observation. • R = Highest – Lowest 2.)Mean Deviation – the sum of all the absolute values of the deviations from the mean divided by the number of observations. MAD = S X – X n
3.) Sample Variance ( S2 ) – the sum of the square of each deviation from the mean divided by the number of observations minus 1. S2 = S ( X – X )2 n – 1 Standard Deviation ( S ) – the square root of variance. S = S ( X- X )2 n – 1
Equations for Population and Sample Means and Standard Deviations Quantity Sample Population Mean X = S Xm = S X n N Variance S2 = S ( X – X )2s2 = S ( X – X )2 n - 1 N Standard S = S ( X – X )2 s = S ( X – X )2 Deviation n – 1 N
Sample Standard Deviation Formula Ungrouped data S = S X2SX 2 n n Grouped data S = nSfX2 - (SfX)2 LONG METHOD n(n-1) S = c nSfd2 - (Sfd)2 CODED METHOD n(n-1)
Averaging Standard Deviation 2 2 2 2 2 ST = nA(XA+SA ) + nB(XB+SB) XT nA+nB where nA,nB – sample sizes XA,XB – mean of the groups XT -mean of the two groups combined SA,S B - standard deviation of the two groups being combined When there are more than two groups, the above formula may be modified by placing additional terms in the numerator and denominator.
Coefficient of Variation • Measure of relative dispersion or percentages • Relates the standard deviation to its mean and convert it to percentage. C.V. = s ( 100 ) X Skewness - is the degree of asymmetry or departure from symmetry exhibited by a frequency distribution. Sk = Mean – Mode = 3 ( Mean – Median) Standard Deviation Standard Deviation
Kurtosis • the degree of peakedness or humpedness’ • Leptokurtic- slender pointed curve. • Platykurtic- flat or broad curve. • Mesokurtic- not too pointed nor too flat. For a mesokurtic distribution, the value of Kurtosis is 3. For a leptokurtic distribution, the value is greater than 3. For a platykurtic distribution, the value is less than 3.