Download
1 / 14
140 likes | 156 Views
Learn about the functional relation between variables, graph basics, slopes of lines, and curve analysis for efficient data depiction and interpretation. Understand the significance of slopes and shifts in curves for economic and marginal analysis. Explore how to read and interpret different types of graphs effectively.

E N D
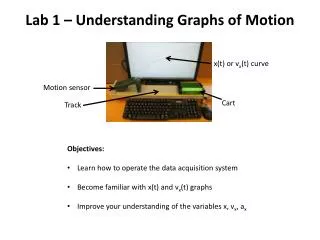
Understanding Graphs CHAPTER 1 Appendix
Graph • Picture showing how variables relate and conveys information in a compact and efficient way • Functional relation exists between two variables when the value of one variable depends on another • The value of the dependent variable depends on the value of the independent variable
Exhibit 4: Basics of a Graph • The value of variable x is measured along the horizontal axis and increases as you move to the right of the origin. • The value of the variable y is measured along the vertical axis and increases as you move upward. • Any point on a graph represents a combination of particular values of two variables. • For example, point a represents the combination of 5 units of variable x and 15 units of variable y, while point b represents 10 units of x and 5 units of y.
Exhibits 6 & 7:Relating Distance Traveled to Hours Driven Hours Distance Driven Traveled Per Per Day Day (miles) a 1 50 b 2 100 c 3 150 d 4 200 e 5 250
Slopes of Straight Lines • Indicates how much the vertical variable changes for a given change in the horizontal variable • Vertical Change divided by the horizontal Change • Slope = Change in the vertical distance / change in the horizontal distance
Exhibit 8: Alternative Slopes for Straight Lines 8a.) Positive relation
Exhibit 8: Alternative Slopes for Straight Lines 8b.) Negative relation
Exhibit 8: Alternative Slopes for Straight Lines 8c.) No relation: zero slope
Exhibit 8: Alternative Slopes for Straight Lines 8d.) No relation: infinite slope
Exhibit 9: Slope Depends on the Unit of Measure Total Cost a) Slope = 1/1 = 1 b) Slope = 3/1 = 3 Total Cost $6 $6 1 5 3 1 3 1 0 0 5 6 1 2 Feet of copper tubing Yards of copper tubing
Slope and Marginal Analysis • Economic analysis usually involves marginal analysis • The slope is a convenient device for measuring marginal effects because it reflects the change in one variable – the effect -- compared to the change in some other variable – the cause • Slope of straight line is the same everywhere along the line
A a B b B A Exhibit 10: Slopes at Different Points on a Curved Line y Slope of curved line varies at different points along curve 40 Draw a straight line that just touches the curve at a point but does not cut or cross the curve – tangent to the curve at that point With line AA tangent to the curve at point a, the horizontal value increases from 0 to 10 while the vertical value falls from 40 to 0 slope of -4 30 20 Slope of the tangent at that point is the slope of the curve at that point 10 0 10 20 30 40 x
a b Exhibit 11: Curves with Both Positive and Negative Ranges y The U-shaped curve begins with a negative slope, has a slope of 0 at point b, and a positive slope after point b. The hill-shaped curve begins with a positive slope to the left of point a, a slope of 0 at point a, and a negative slope to the right of point a. x
Exhibit 12: Shift in Curve Relating Distance Traveled to Hours Driven T' f ) s e l i T m ( 250 y a d d r 200 e p d A change in the assumption about average speed changes the relationship between the two variables. 150 e l e v a 100 r t e c n 50 a t s i D 0 1 2 3 4 5 Hours driven per day