Download
1 / 108
1.31k likes | 1.86k Views
Vegetation Index (VI). Normalized Difference Vegetation Index (NDVI). Today’s Goal. Rancher’s in New Mexico need an insurance program for their grazing and haying perils RMA is committed to meeting those needs Limited options Pros and Cons to both programs (RI/VI)

E N D
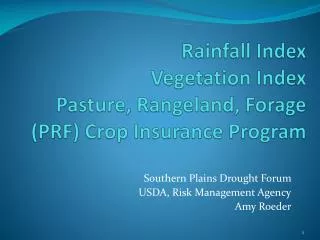
Vegetation Index (VI) Normalized Difference Vegetation Index (NDVI)
Today’s Goal • Rancher’s in New Mexico need an insurance program for their grazing and haying perils • RMA is committed to meeting those needs • Limited options • Pros and Cons to both programs (RI/VI) • Can program improvements be implemented for VI • Limit available Index Intervals to assure production for the year is captured? • What time periods should be offered? • Do producers prefer RI?
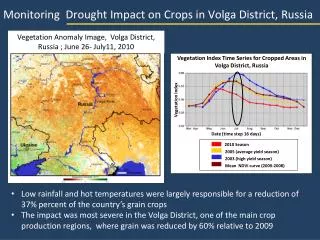
Where we are today? • Ten Index Intervals during a year • ONLY Four intervals have been released to date • Latest interval released to date: April-June • First three intervals covered winter and early spring months that normally have very low NDVI readings as plants are dormant or beginning to green up • Above average biomass carry over from 2010 • Drought conditions in New Mexico, Texas, Oklahoma, etc. with catastrophic impacts • Impacts to the industry as a whole
History • The Agricultural Risk Protection Act of 2000 (ARPA) mandates programs to cover pasture and rangeland • Vegetation Index - Pasture, Rangeland, Forage (VI-PRF) • Rainfall Index - Pasture, Rangeland, Forage (RI-PRF)
Challenges – PRF • Pasture, Rangeland, Forage Crop • Various plant species • Timing of plant growth • Lack of individual/industry data • Vast range of management practices across the industry • Publicly announced prices not available • Crop continuously harvested via livestock
History • Statement of Objectives issued by RMA • Contractors put together ideas and proposals • 16 proposals received • All were indexes • Rainfall Index • Vegetation Index • RMA awarded four contracts • 2 were Rainfall Indexes • 2 were Vegetation Indexes • 2 were implemented
Fact or Fiction Vegetation Index utilizes remote sensing measures for the grid. • All biomass in a grid is included • Does not measure grass only • Deviation of normal for the interval (1989 to 2009) THIS IS NOT DROUGHT INSURANCE (Multi Peril) • RMA does not use the term drought for the Vegetation Index program nor for the Rainfall Index program
Program Overview Area Plan of insurance • Not individual coverage • Losses are area based, not producer based • Index – based on NDVI (a proxy for vegetation biomass) • Not measuring actual individual production • No loss adjustments, records, etc. • More timely payments • Does not reward poor management practices
Program Overview • Rating • Each grid, index interval, and coverage level is individually rated • Encourages producers to select a scenario that best mitigates their operation/production risks • Critical that producers select the correct interval for RI or VI • Encourage producers to view rates, BUT that should not be the determining factor in selecting which index interval(s) to insure.
Program Overview • Index Intervals • Minimizes dependency on subjective pre-determined biomass growing seasons • Elevation, climate, etc. found within an area • Maintains consistency across the country • Allows for regional and local variance • Allows individual freedom to select appropriate intervals
Program Overview - VI • Vegetation Index Program • Area Based Plan • Approximately 8 x 8 km grid vs. county • Utilizes satellite remote sensing data • Normalized Difference Vegetation Index (NDVI) • Deviation from Normal: 1989 to 2009, captures multiple perils • Review of historical indices and how they relate to your ranch is critical • Critical that peak of growing season is insured and not time periods outside those months
Grid Overview – VI • Area of insurance = 8 x 8 km(~ 4.9 x 4.9 miles)
Program Overview – VI (&RI) • Coverage Levels • Percentages available: 90, 85, 80, 75, and 70 • Consistent with other area programs • Catastrophic Risk Protection (CAT) • Not currently available • Producers are eligible for NAP coverage
Program Overview • Not required to insure 100% of acreage • Forage utilized in the annual grazing or hay cycle can be insured without insuring all acreage • All acres within a property may not be productive, e.g., rocky areas, submerged areas • Provides additional flexibility for the rancher to design the coverage to their specific needs • Because the program is an area plan, there is no opportunity to ‘move’ production • Producers cannot affect trigger
Index Definitions • Expected Grid Index:Based on the historical mean accumulated NDVI values, by Index Interval, expressed as a percentage; EGI = 100 • Final Grid Index:Based on the current NDVI values for each Index Interval • If current data represents a 40% reduction, then FGI = 60 • Trigger Grid Index: The selected coverage level multiplied by the Expected Grid Index • i.e. - Coverage Level = 85; then Trigger Grid Index = 85 • If the final grid index falls below the trigger grid index, the insured may be due an indemnity
Program Overview • Payment Calculations • The only insurable cause of loss is when the final grid index value is less than the trigger grid index, and only when caused by a natural occurrence • If the cause is determined by FCIC to be an act of man or intentional, a method of assigning the Vegetation Index value from the nearest unaffected grid will be used to establish a final grid index value for the grid affected
2011 Changes: Filed 6/30/2010 • Addition of Total Loss Factor (VI ONLY) • Accelerates the level of loss at which the maximum indemnity amount would be made – allows producers to obtain 100% payouts more frequently • VI Program expanded to balance of counties in Idaho, Oregon and South Dakota and all counties in Arizona, New Mexico, and Utah NO CHANGES ARE MADE TO THE PROGRAM AFTER THE CONTRACT CHANGE DATE (CCD) (6/30)
VI – Program Overview Index Intervals • Crop Year divided into 10, 3-month index intervals • Must select at least one interval • Currently can select up to 4 intervals • Crop Practice = Index Interval • Ability for producers to manage appropriate timing risks • Correlate to individual growth patterns and production seasons • The 3-month intervals provide for greater reaction to biomass reduction events vs. a yearly average
Technology – VI (2011) • USGS – EROS Data: • Historical Data can be retrieved from: • http://edcsns17.cr.usgs.gov/EarthExplorer/ • Select the AVHRR composites • Bi-weekly composite – • http://ivm.cr.usgs.gov/ • NDVI is band 6 in the binary image • Information about the data http://ivm.cr.usgs.gov/Metadata.doc • NDVI images are processed by the EROS data center and are not further processed by RMA
Characteristics of the NDVI used for PRF • Data from AVHRR satellite are processed by USGS EROS and made available from 1989 to present. • AHVRR data is collected daily, however the product used is the 14-day maximum NDVI composite image • Resolution of the data is 1-km, but aggregated to 8 km for the group insurance.
1x1 km NDVI Grids Averaged to 8x8 km Grids 4 km2 = 1.5 sections
Data Processing for PRF Vegetation Index • NDVI data are acquired from EROS Data Center every 14 days • At the end of each indexing interval, the NDVI images are staged for the insurance indexing. The data are screened to remove negative NDVI values (clouds, water, etc). • Negative NDVI values are not used in the index calculations
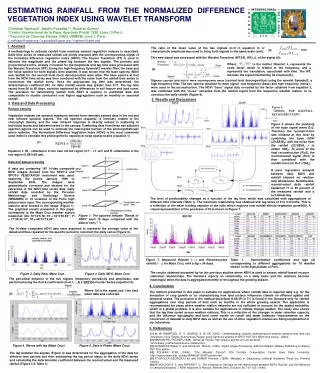
Vegetation Index Calculations • Calculation of the Final Grid Index has 3 stages: • Calculation of the daily index values • Averaging the daily index to calculate the interval index • Standardizing the current interval index to the long-term average of the historical interval indices
Daily Index Calculations • A daily vegetation condition index is calculated for each grid where: Daily Index i= daily vegetation condition index for day i NDVIi= NDVI for day i NDVImini= the minimum NDVI across all years for day i NDVImaxi= the maximum NDVI across all years for day i Note: 200 is an arbitrary scalar . . . adapted from Kogan (1990, 1995) Vegetation Condition Index
Daily Index Calculation Historical Maximum NDVIon June 1 NDVI on June 1, 2011 Daily Index for June 1= 49.7 Historical Minimum NDVIon June 1
Daily Index Calculation • The Daily Index equation is basically answering the question of “How does today’s vegetation compare to the “best” and the “worst” conditions for this day historically as seen by the satellite. • Daily Index values near zero indicate relatively poor condition of the vegetation compared to the history for that day • Does not mean that no vegetation is present! • So, if the “worst” day historically for a given day had evergreen vegetation present such as cholla, creosote bush, and juniper, then this “greenness” does not influence the daily vegetation condition index because that “greenness” is the minimum value. • High values indicate relatively good vegetation condition compared to the history on that day
Final Grid Index Calculation • For each interval, the daily index values are averaged for the interval of interest to calculate the Index Interval. • The Final Grid Index is then calculated by dividing the Index Interval by the long-term average of the historical indices for the interval in question.
NDVI Conditions – December 2010 • NDVI Image for December 14 – 28, 2010 • EROS Data Center • Indicates the gradation of greenness • across New Mexico • Greener areas indicate higher levels of • photosynthesizing leaf area • NDVI Departure from Long-Term Average • US Forest Service - Wildland Fire Assessment • System • Compares current NDVI to long-term average • Greener areas indicate NDVI is greater than • long term average. • Yellow to Red areas indicate the opposite
NDVI Conditions – February 2011 NDVI Image for February 8 to 21, 2011 EROS Data Center Green area has declined compared to December NDVI Departure from Long-Term Average – Feb 21 US Forest Service - Wildland Fire Assessment System Majority of New Mexico for this period is showing above average NDVI conditions Some of the forested areas showing below average conditions
NDVI Conditions – April, 2011 NDVI Image for April 5 to 18, 2011 EROS Data Center NDVI Departure from Long-Term Average – April 18 US Forest Service - Wildland Fire Assessment System Majority of New Mexico for this period is showing average to above average NDVI conditions Eastern New Mexico is showing declining NDVI conditions
NDVI Conditions – June 2011 NDVI Image for May 31 to Jun 13, 2011 EROS Data Center NDVI Departure from Long-Term Average – June 13 US Forest Service - Wildland Fire Assessment System Majority of New Mexico for this period is showing below average NDVI conditions Eastern New Mexico is showing large departures from average
NDVI Conditions – August 2011 NDVI Image for August 8 to 23, 2011 EROS Data Center NDVI Departure from Long-Term Average – August 1 US Forest Service - Wildland Fire Assessment System Majority of New Mexico for this period is showing below average NDVI conditions
Interval 647 Mar 1 to May 31 Final Index = 159.7 Interval 646 Feb 1 to Apr 30 Final Index = 174.6 Interval 645 Jan 1 to Mar 31 Final Index = 155.1 Interval 649 May 1 to July 31 Final Index = 40.95 Interval 648 Apr 1 to Jun 30 Final Index = 102.2 90% 85% 80% 75% 70%
Interval 645 Jan 1 to Mar 31 Final Index = 160.5 Interval 646 Feb 1 to Apr 30 Final Index = 165.58 Interval 647 Mar 1 to May 31 Final Index = 144.8 Interval 649 May 1 to July 31 Final Index = 53.61 Interval 648 Apr 1 to Jun 30 Final Index = 9.06 90% 85% 80% 75% 70%
Interval 645 Jan 1 to Mar 31 Final Index = 170.0 Interval 646 Feb 1 to Apr 30 Final Index = 152.2 Interval 647 Mar 1 to May 31 Final Index = 121.9 Interval 649 May 1 to July 31 Final Index = 38.8 Interval 648 Apr 1 to Jun 30 Final Index = 77.38 90% 85% 80% 75% 70%
Interval 645 Jan 1 to Mar 31 Final Index = 165.05 Interval 646 Feb 1 to Apr 30 Final Index = 145.0 Interval 647 Mar 1 to May 31 Final Index = 128.9 Interval 649 May 1 to July 31 Final Index = 75.3 Interval 648 Apr 1 to Jun 30 Final Index = 106.4 90% 85% 80% 75% 70%
Program Overview - RI • Rainfall Index Program • Area Based Plan • 0.25 degree grid vs. county • Utilizes NOAA daily reported weather data • NOAA: Climate Prediction Center (CPC) • Deviation from Normal: 1948 to 2009 • Review of historical indices and how they relate to your ranch is critical • Critical that critical precipitation periods are insured and not time periods outside those months
Program Overview - RI • Crop Year divided into 11, 2-month index intervals • Must select at least two intervals • Currently can select up to 6 intervals • Crop Practice = Index Interval • Ability for producers to manage appropriate timing risks • The 2-month intervals provide for greater reaction to biomass reduction events vs. a yearly average
Grid Overview - RI • Area of insurance = 0.25o grids
Technology - RI • NOAA CPC data • NOAA wants to use the best data available for their programs too • NOAA rainfall data based on the Optimal Interpolation (OI) methodology • Historical data (1948 to 2006) currently can be retrieved from NOAA at the following website: ftp://ftp.cpc.ncep.noaa.gov/precip/CPC_UNI_PRCP/GAUGE_CONUS/V1.0/ • Near real-time data (2006 to present) is currently accessed from ftp://ftp.cpc.ncep.noaa.gov/precip/CPC_UNI_PRCP/GAUGE_CONUS/RT/
Technology - RI • For 2011 results: the historical period for calculating the long term average is Jan.1, 1948 through Dec. 31, 2009 • Precipitation is interpolated to the grid and not measured within a grid • Producers MUST understand that even if there is a weather station that reports daily to NOAA CPC inside their grid, the results will NOT equal that weather station • Similar to NASS data used for GRP crop policies • Producers reporting to NASS – unknown • Surveys NASS eliminates in their quality control – unknown
What we hear - RI • Rancher’s believe RMA is using a single point specific weather station • Rancher’s provide NWS, NCDC, WFO, or other NOAA/USGS/NASA data sets, airport weather reports, etc. • Rancher’s use their own rain gauges • Rancher’s believe grid results will always reflect exact conditions on their ranch • Purpose: to provide general rainfall conditions in a grid, not measure a single gauge
NAP and PRF Clarification FSA NAP Coverage and RMA PRF Pilot Insurance Program Coverage Policy • Producers can obtain both a PRF policy (VI or RI as applicable) and NAP coverage on the same acres for the same intended use • Eligible to earn a PRF indemnity payment and NAP benefit on the same acres for the same intended use
Web Based Tools www.rma.usda.gov