Download
1 / 53
540 likes | 863 Views
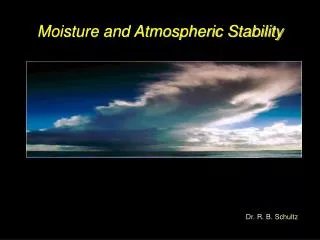
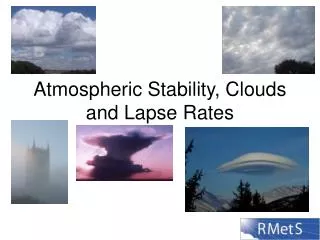
Convection and Atmospheric Stability . AOS 101 Dis. 305. Atmospheric Stability. What is stability? Stability refers to a condition of equilibrium If we apply some perturbation to a system, how will that system be affected? Stable: System returns to original state

E N D
Convection and Atmospheric Stability AOS 101 Dis. 305
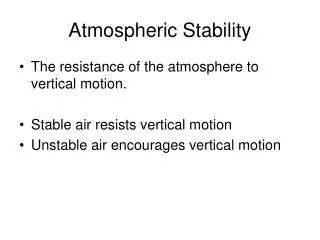
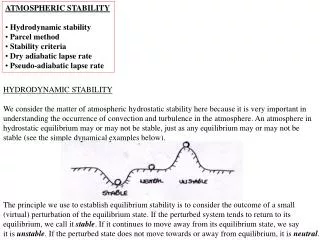
Atmospheric Stability • What is stability? • Stability refers to a condition of equilibrium If we apply some perturbation to a system, how will that system be affected? • Stable: System returns to original state • Unstable: System continues to move away from original state • Neutral: System remains steady after perturbed
Stability Example Stable: Marble returns to its original position Unstable: Marble rapidly moves away from initial position
Stability How does a bowl and marble relate to the atmosphere?? • When the atmosphere is stable, a parcel of air that is lifted will want to return back to its original position: http://www.maltaweather.info/cumulus.jpg
Stability • When the atmosphere is unstable (with respect to a lifted parcel of air), a parcel will want to continue to rise if lifted: http://blogs.trb.com/news/weather/weblog/wgnweather/archives/051906_cumulus_clouds.jpg
What do we mean by an air parcel? • Imaginary small body of air a few meters wide • Can expand and contract freely • Does not break apart • Only considered with adiabatic processes - External air and heat cannot mix with the air inside the parcel. The parcel warms or cools purely due to pressure changes. • Space occupied by air molecules inside parcel defines the air density • Average speed of molecules directly related to air temperature • Molecules colliding against parcel walls define the air pressure inside
Buoyancy and Stability • Since Pressure is the same, the only other variable changing is temperature. But remember they are on the same side of the equation so they are inversely proportional • So if ρparcel < ρenv. Then the parcel floats or in other words is positively buoyant • In terms of temperature that would mean If T of parcel > T of environment the parcel is positively buoyant (less dense and will rise) (unstable) (or less stable) T of parcel < T of environment the parcel is negatively buoyant (more dense and will sink) (stable) T of parcel = T of environment the parcel is neutrally buoyant (will not rise or sink) (neutral)
Atmospheric Soundings • Vertical “profiles” of the atmosphere are taken at 0000 UTC (7 AM CDT) and 1200 UTC (7 PM CDT) at ~80 stations across the country, and many more around the world. Sometimes also launched at other times when there is weather of interest in the area. • Weather balloons rise to over 50,000 feet and take measurements of several meteorological variables using a “radiosonde.” http://www.ua.nws.noaa.gov/nws_upper.htm
Temperature • Dew point temperature • Wind Direction and Speed • Pressure • From these variables we can find the following: • Saturation Mixing Ratio • Mixing Ratio http://www2.ljworld.com/photos/2006/may/24/98598/
Temp. Sensor Radiosonde Package Balloon Attachment point Humidity Sensor GPS antenna Unwinder www.chmi.cz/meteo/ oap/eoap_basic.html Reciever/Processor Calibration check box Transmitter Antenna
Inflating the balloon http://www.wrh.noaa.gov/rev/tour/UA/inflation.php
Baselining the Radiosonde Sensor Inspection and Battery Materials, write down the radiosonde calibration information Radiosonde being Baselined and Acquiring GPS Information http://www.wrh.noaa.gov/rev/tour/UA/baseline.php
Balloon Launch airport Reno-Tahoe International Airport view from Launch Site Before the launch, obtain measurements of local T, humidity, and P Wait to get clearance from Federal Aviation Administration (FAA) (http://www.wrh.noaa.gov/rev/tour/UA/launch.php)
Balloon Launch After release the balloon, activate the tracking system and monitor the data during the ascent. Pre-launch takes about 30 mins, while sounding may take about 90 mins. (http://www.wrh.noaa.gov/rev/tour/UA/launch.php)
Vertical Profile of Atmospheric Temperature, Allow us to assess Atmospheric Stability We must compare the parcel's temerature Tp with the temperature of the surrounding environment Te. Tp > Te The parcel is positively buoyant, it is less dense and will rise. Tp < Te The parcel is negatively buoyant, it is more dense and will sink. Tp = Te The parcel is neutrally buoyant, it will not rise or sink.
Lapse Rates Lapse Rate:The rate at which temperature decreases with height (Remember the inherent negative wording to it) Environmental Lapse Rate:Lapse rates associated with an observed atmospheric sounding (negative for an inversion layer) Parcel Lapse Rate: Lapse rate of a parcel of air as it rises or falls (either saturated or not) MALR - Moist Adiabatic Lapse Rate: Saturated air parcel DALR - Dry Adiabatic Lapse Rate: Dry air parcel
DALR • Air in parcel must be unsaturated (Relative Humidity < 100%) • Rate of adiabatic heating or cooling = 9.8°C for every 1000 meter (1 kilometer) change in elevation • Parcel temperature decreases by about 10°C if parcel is raised by 1km, and increases about 10°C if it is lowered by 1km
MALR • As rising air cools, its RH increases because the temperature approaches the dew point temperature, Td • If T = Td at some elevation, the air in the parcel will be saturated (RH = 100%) • If parcel is raised further, condensation will occur and the temperature of the parcel will cool at the rate of about 6°C per 1km in the mid-latitudes
DALR vs. MALR • The MALR is less than the DALR because of latent heating • As water vapor condenses into liquid water for a saturated parcel, LH is released, lessening the adiabatic cooling Remember no heat exchanged with environment
Absolute Stability • The atmosphere is absolutely stable when the environmental lapse rate (ELR) is less than the MALR • ELR < MALR < DALR • A saturated OR unsaturated parcel will be cooler than the surrounding environment and will sink, if raised
Absolute Stability • Inversion layers are always absolutely stable • Temperature increases with height • Warm air above cold air = very stable
Absolute Instability • The atmosphere is absolutely unstable when the ELR is greater than the DALR • ELR > DALR > MALR • An unsaturated OR saturated parcel will always be warmer than the surrounding environment and will continue to ascend, if raised
Conditional Instability • The atmosphere is conditionally unstable when the ELR is greater than the MALR but less than the DALR • MALR < ELR < DALR • An unsaturated parcel will be cooler and will sink, if raised • A saturated parcel will be warmer and will continue to ascend, if raised
Conditional Instability • Example: parcel at surface • T(p) = 30°C, Td(p) = 14°C (unsaturated) • ELR = 8°C/km for first 8km • Parcel is forced upward, following DALR • Parcel saturated at 2km, begins to rise at MALR • At 4km, T(p) = T(e)…this is the level of free convection (LFC)
Conditional Instability • Example continued… • Now, parcel will rise on its own because T(p) > T(e) after 4km • The parcel will freely rise until T(p) = T(e), again • This is the equilibrium level (EL) • In this case, this point is reached at 9km • Thus, parcel is stable from 0 – 4km and unstable from 4 – 9km LCL - Lifting condensation level
Lifting by Convection • As the earth is heated by the sun, thermals (bubbles of hot air) rise upward from the surface • The thermal cools as it rises, losing some of its buoyancy (its ability to rise) • The vertical extent of the cloud is largely determined by the stability of the environment
Lifting by Convection • A deep stable layer restricts continued vertical growth • A deep unstable layer will likely lead to development of rain-producing clouds • These clouds are more vertically developed than clouds developed by convergence lifting
Lifting by Convergence • Convergence exists when there is a horizontal net inflow into a region • When air converges along the surface, it is forced to rise
Lifting by Convergence • Large scale convergence can lift air hundreds of kilometers across • Vertical motions associated with convergence are generally much weaker than ones due to convection • Generally, clouds developed by convergence are less vertically developed
Lifting due to Topography • This type of lifting occurs when air is confronted by a sudden increase in the vertical topography of the Earth • When air comes across a mountain, it is lifted up and over, cooling as it is rising • The type of cloud formed is dependent upon the moisture content and stability of the air
Lifting Along Frontal Boundaries • Front – The transition zone between two air masses of different densities • Lifting occurs along two different types of fronts • Cold Front • Warm Front
Lifting Along Cold Fronts • A colder,denser air mass lifts the warm, moist air ahead of it • As the air rises, it cools and condenses, producing clouds and precipitation • The steep slope of the cold front leads to more vigorous rising motion • Hence, cold fronts are often associated with thunderstorms
Lifting Along Warm Fronts • A warmer, less dense air mass rises up and over the cold air ahead of the warm front • Air rises, cools and condenses • Warm fronts have gentler slopes and move slower than cold fronts • Generally, precipitation is more steady and widespread
Skew T Log P Diagram • It is called Skew-T Log-P because the temperature axis (x axis) is skewed and the pressure axis (the vertical coordinate) is a logorithmic axis. • Area α Energy/Work • There are several set of lines on a Skew-T Log-P diagram and they will be shown in the next couple slides.
Temperature Lines (Isotherms) Isotherms
Lifting Condensation Level (LCL) • Level at which a parcel lifted from the surface would reach saturation (i.e. level at which temperature = dewpoint temperature) • LCL will refer to the height above the ground at which the cloud base is located
Level of Free Convection (LFC) Level at which a parcel lifted from the surface would be warmer than its environment Above this level, air is able to freely convect, or ascend without resistance to the tropopause Equilibrium Level (EL) Level at which a parcel is no longer warmer than its environment, usually is the tropopause Above the tropopause, environmental temperature increases with height in the stratosphere -Corresponds to cloud top height
12 EL 10 Tparcel 8 Tenv Height (km) 6 LFC 4 LCL 2 Td -40 -30 -20 -10 0 10 20 30 Temperature (C)
How to read from the diagram? • Each point on the plot corresponds to a temperature and pressure value. Temperature scale in blue can be read from the bottom of the plot. • For example: • A: • Pressure : 250 mb • Temperature : -20 C • B: • Pressure : 600 mb • Temperature : -10 C • C: • Pressure : 900 mb • Temperature : 25C (Since it is exactly in between the line when T =20 and T=30 C) A B C