Download
1 / 1
10 likes | 76 Views
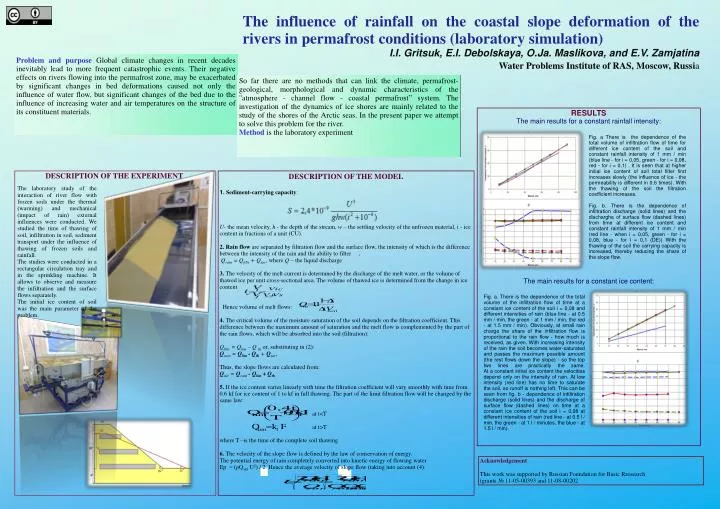
The influence of rainfall on the coastal slope deformation of the rivers in permafrost conditions (laboratory simulation) I.I. Gritsuk, E.I. Debolskaya, O.Ja. Maslikova, and E.V. Zamjatina Water Problems Institute of RAS, Moscow, Russi a.

E N D
The influence of rainfall on the coastal slope deformation of the rivers inpermafrost conditions (laboratory simulation) I.I. Gritsuk, E.I. Debolskaya, O.Ja. Maslikova, and E.V. Zamjatina Water Problems Institute of RAS, Moscow, Russia Problem and purpose Global climate changes in recent decades inevitably lead to more frequent catastrophic events. Their negative effects on rivers flowing into the permafrost zone, may be exacerbated by significant changes in bed deformations caused not only the influence of water flow, but significant changes of the bed due to the influence of increasing water and air temperatures on the structure of its constituent materials. So far there are no methods that can link the climate, permafrost-geological, morphological and dynamic characteristics of the "atmosphere - channel flow - coastal permafrost” system. The investigation of the dynamics of ice shores are mainly related to the study of the shores of the Arctic seas. In the present paper we attempt to solve this problem for the river. Methodis the laboratory experiment. RESULTS The main results for a constant rainfall intensity: The main results for a constant ice content: Fig. a There is the dependence of the total volume of infiltration flow of time for different ice content of the soil and constant rainfall intensity of 1 mm / min (blue line - for i = 0,05, green - for i = 0,08, red - for i = 0,1) . It is seen that at higher initial ice content of soil total filter first increases slowly (the influence of ice - the permeability is different in 0.6 times). With the thawing of the soil the filtration coefficient increases. Fig. b. There is the dependence of infiltration discharge (solid lines) and the discharghe of surface flow (dashed lines) from time at different ice content and constant rainfall intensity of 1 mm / min (red line - when i = 0,05, green - for i = 0,08, blue - for i = 0,1 (DE)) With the thawing of the soil the carrying capacity is increased, thereby reducing the share of the slope flow. DESCRIPTION OF THE EXPERIMENT DESCRIPTION OF THE MODEL 1. Sediment-carrying capacity: U- the mean velocity, h - the depth of the stream, w – the settling velocity of the unfrozen material, i - ice content in fractions of a unit (CU). 2. Rain flow are separated by filtration flow and the surface flow, the intensity of which is the difference between the intensity of the rain and the ability to filter Qrain = Qfiltr + Qsur, where Q – the liquid discharge 3. The velocity of the melt current is determined by the discharge of the melt water, or the volume of thawed ice per unit cross-sectional area. The volume of thawed ice is determined from the change in ice content Hence volume of melt flows: 4. The critical volume of the moisture saturation of the soil depends on the filtration coefficient. This difference between the maximum amount of saturation and the melt flow is complemented by the part of the rain flows, which will be absorbed into the soil (filtration): Qfiltr = Qlim – Qthor, substituting in (2): Qrain =Qlim- Qth+ Qsur, Thus, the slope flows are calculated from: Qsur=Qrain - Qlim+ Qth 5. If the ice content varies linearly with time the filtration coefficient will vary smoothly with time from 0.6 kf for ice content of 1 to kf in full thawing. The part of the limit filtration flow will be changed by the same law: at t<T att>T where T –is the time of the complete soil thawing 6. The velocity of the slope flow is defined by the law of conservation of energy.The potential energy of rain completely converted into kinetic energy of flowing water Ep = (ρQskl U2) / 2. Hence the average velocity of slope flow (taking into account (4): The laboratory study of the interaction of river flow with frozen soils under the thermal (warming) and mechanical (impact of rain) external influences were conducted. We studied the time of thawing of soil, infiltration in soil, sediment transport under the influence of thawing of frozen soils and rainfall. The studies were conducted in a rectangular circulation tray and in the sprinkling machine. It allows to observe and measure the infiltration and the surface flows separately. The initial ice content of soil was the main parameter of the problem. Fig. a. There is the dependence of the total volume of the infiltration flow of time at a constant ice content of the soil i = 0,08 and different intensities of rain (blue line - at 0.5 mm / min, the green - at 1 mm / min, the red - at 1.5 mm / min). Obviously, at small rain charge the share of the infiltration flow is proportional to the rain flow - how much is received, as given. With increasing intensity of the rain the soil becomes water-saturated and passes the maximum possible amount (the rest flows down the slope) - so the top two lines are practically the same.At a constant initial ice content the velocities depend only on the intensity of rain. At low intensity (red line) has no time to saturate the soil, so runoff is nothing left. This can be seen from fig. b - dependence of infiltration discharge (solid lines) and the discharge of surface flow (dashed lines) on time at a constant ice content of the soil i = 0,08 at different intensities of rain (red line - at 0.5 l / min, the green - at 1 l / minutes, the blue - at 1.5 l / min). Acknowledgement This work was supported by Russian Foundation for Basic Rresearch (grants № 11-05-00393 and 11-08-00202