Download
1 / 8
90 likes | 125 Views
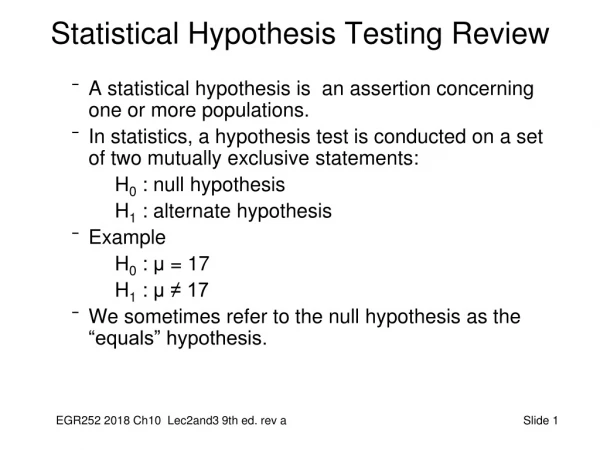
Statistical Hypothesis Testing - Part 3. A statistical hypothesis is an assertion concerning one or more populations. In statistics, a hypothesis test is conducted on a set of two mutually exclusive statements: H 0 : null hypothesis H 1 : alternate hypothesis

E N D
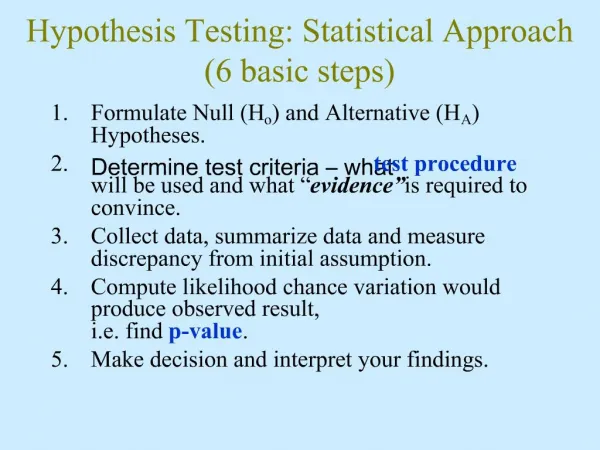
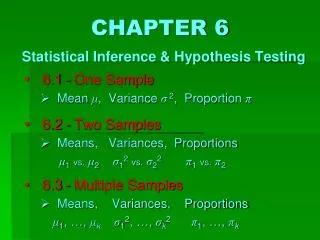
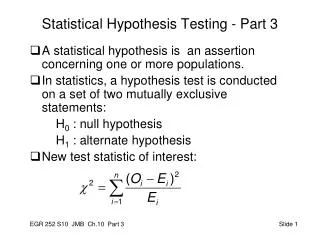
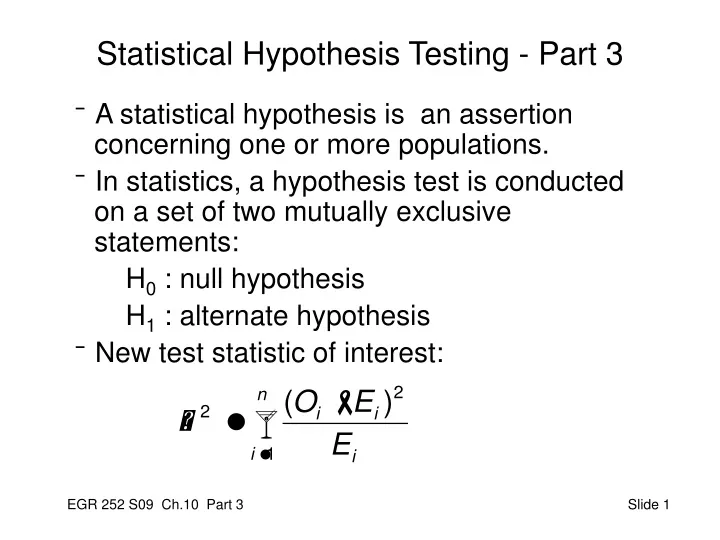
Statistical Hypothesis Testing - Part 3 • A statistical hypothesis is an assertion concerning one or more populations. • In statistics, a hypothesis test is conducted on a set of two mutually exclusive statements: H0 : null hypothesis H1 : alternate hypothesis • New test statistic of interest:
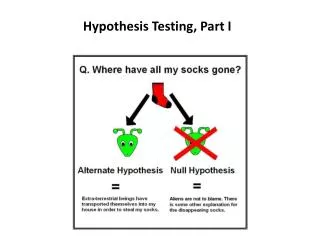
Goodness-of-Fit Tests • Procedures for confirming or refuting hypotheses about the distributions of random variables. • Hypotheses: H0: The population follows a particular distribution. H1: The population does not follow the distribution. Example: H0: The data come from a normal distribution. H1: The data do not come from a normal distribution.
Goodness of Fit Tests (cont.) • Test statistic is χ2 • Draw the picture • Determine the critical value for goodness of fit test χ2 with parameters α, ν = k – 1 • Calculate χ2 from the sample • Compare χ2calcto χ2crit • Make a decision about H0 • State your conclusion. • Discussion: Look at Table 10.4 in text.
Tests of Independence • Example: Choice of pension plan. • Hypotheses H0: Pension Plan Choice and Worker Type are independent H1: Pension Plan Choice and Worker Type are not independent 1. Develop a Contingency Table
Worker vs. Pension Plan Example 2. Calculate expected probabilities P(#1 ∩ S) = ____________ E(#1 ∩ S) = __________ P(#1 ∩ H) = ____________ E(#1 ∩ H) = __________ (etc.)
Hypotheses • Define Hypotheses H0: the categories (worker & plan) are independent H1: the categories are not independent 4. Calculate the sample-based statistic (160-136)^2/136 + (140-136)^2/136 + (40-68)^2/68 + (40-64)^2/64 + (60-64)^2/64 + (60-32)^2/32 = 49.63
The Chi-Squared Test of Independence 5. Compare to the critical statistic for a test of independence, χ2α, r where r = (a – 1)(b – 1) a = # of columns b = # of rows For our example, let’s use α = 0.01 _ χ20.01,2_ = 9.210 (from Table A.5, pp 756) Comparison: χ2 calc> χ2 crit Decision: Reject the null hypothesis Conclusion: Worker and plan are not independent.