Download
1 / 1
10 likes | 145 Views
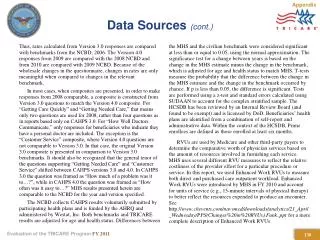
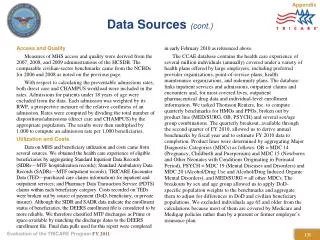
Data Sources (cont.). Access and Quality Measures of MHS access and quality were derived from the 2007, 2008, and 2009 administrations of the HCSDB. The comparable civilian-sector benchmarks came from the NCBDs for 2006 and 2008 as noted on the previous page.

E N D
Data Sources(cont.) Access and Quality Measures of MHS access and quality were derived from the 2007, 2008, and 2009 administrations of the HCSDB. The comparable civilian-sector benchmarks came from the NCBDs for 2006 and 2008 as noted on the previous page. With respect to calculating the preventable admissions rates, both direct care and CHAMPUS workload were included in the rates. Admissions for patients under 18 years of age were excluded from the data. Each admission was weighted by its RWP, a prospective measure of the relative costliness of an admission. Rates were computed by dividing the total number of dispositions/admissions (direct care and CHAMPUS) by the appropriate population. The results were then multiplied by 1,000 to compute an admission rate per 1,000 beneficiaries. Utilization and Costs Data on MHS and beneficiary utilization and costs came from several sources. We obtained the health care experience of eligible beneficiaries by aggregating Standard Inpatient Data Records (SIDRs—MTF hospitalization records); Standard Ambulatory Data Records (SADRs—MTF outpatient records); TRICARE Encounter Data (TED—purchased care claims information) for inpatient and outpatient services; and Pharmacy Data Transaction Service (PDTS) claims within each beneficiary category. Costs recorded on TEDs were broken out by source of payment (DoD, beneficiary, or private insurer). Although the SIDR and SADR data indicate the enrollment status of beneficiaries, the DEERS enrollment file is considered to be more reliable. We therefore classified MTF discharges as Prime or space-available by matching the discharge dates to the DEERS enrollment file. Final data pulls used for this report were completed in early February 2010 as referenced above. The CCAE database contains the health care experience of several million individuals (annually) covered under a variety of health plans offered by large employers, including preferred provider organizations, point-of-service plans, health maintenance organizations, and indemnity plans. The database links inpatient services and admissions, outpatient claims and encounters and, for most covered lives, outpatient pharmaceutical drug data and individual-level enrollment information. We tasked Thomson Reuters, Inc. to compute quarterly benchmarks for HMOs and PPOs, broken out by product line (MED/SURG, OB, PSYCH) and several sex/age group combinations. The quarterly breakout, available through the second quarter of FY 2010, allowed us to derive annual benchmarks by fiscal year and to estimate FY 2010 data to completion. Product lines were determined by aggregating Major Diagnostic Categories (MDCs) as follows: OB = MDC 14 (Pregnancy, Childbirth and Puerperium) and MDC 15 (Newborns and Other Neonates with Conditions Originating in Perinatal Period), PSYCH = MDC 19 (Mental Diseases and Disorders) and MDC 20 (Alcohol/Drug Use and Alcohol/Drug Induced Organic Mental Disorders), and MED/SURG = all other MDCs. The breakouts by sex and age group allowed us to apply DoD-specific population weights to the benchmarks and aggregate them to adjust for differences in DoD and civilian beneficiary populations. We excluded individuals age 65 and older from the calculations because most of them are covered by Medicare and Medigap policies rather than by a present or former employer’s insurance plan. Appendix 131