Download
1 / 21
240 likes | 464 Views
Body Composition. What is body composition?. The ratio of lean body mass to body fat Generally this is a topic many physical educators try to avoid

E N D
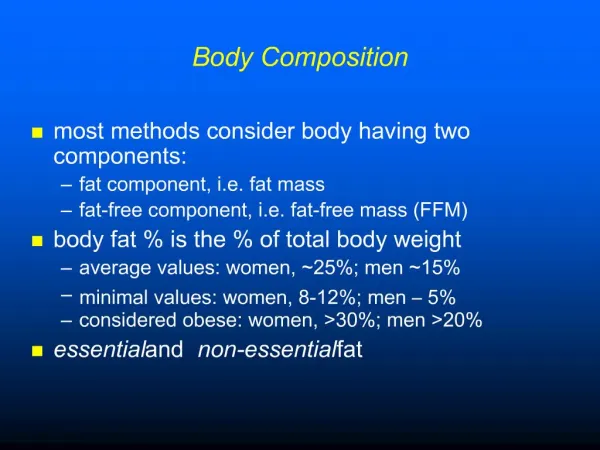
What is body composition? • The ratio of lean body mass to body fat • Generally this is a topic many physical educators try to avoid • Although “exact” figures for % fat may not be necessary, it is important for students to understand the relationship of physical activity to body comp
Adolescent Body Fat • Males: min. = 10%, max = 25% • Females: min = 17%, max = 32%
Definitions of Overweight:(Based on ht /wt tables) • Moderately Overweight • 20% over desirable body weight • Severely overweight • 40% over desirable body weight Burton, Foster, Hirsch, and Van Itallie, Health implications of obesity: An NIH consensus development conference. Int J. Obesity, 9, 155-169, 1985. Problem: Ht/Wt tables do not take muscles mass into account
Obesity • 120 percent of ideal body weight or greater
Overweight and Obesity:New Mexico • 58% of New Mexico adults are overweight or obese. (CDC BRFSS, 2004) • 18% of non-Hispanic white adults and 25% of Hispanic adults in New Mexico are obese. (CDC BRFSS, 2004)
Overweight and Obesity:New Mexico • 24% of New Mexico high-school students are overweight or at risk of becoming overweight. (NM YRRS, 2003) • 22% of low-income children between 2 and 5 years of age in New Mexico are overweight or at risk of becoming overweight. (CDC PedNSS, 2002)
Obesity Trends* Among U.S. AdultsBRFSS, 1990 No Data <10% 10%–14% (*BMI ≥30, or ~ 30 lbs overweight for 5’ 4” person)
No Data <10% 10%–14% 15%–19% Obesity Trends* Among U.S. AdultsBRFSS, 1996 (*BMI ≥30, or ~ 30 lbs overweight for 5’ 4” person)
Obesity Trends* Among U.S. AdultsBRFSS, 2001 (*BMI ≥30, or ~ 30 lbs overweight for 5’ 4” person) No Data <10% 10%–14% 15%–19% 20%–24% ≥25%
Obesity Trends* Among U.S. AdultsBRFSS, 2004 (*BMI ≥30, or ~ 30 lbs overweight for 5’ 4” person) No Data <10% 10%–14% 15%–19% 20%–24% ≥25%
Possible factors for overweight/obesity Inactivity Cultural differences Genetics Contentment with body weight Fast food TV time Eating disorders
Relate to other HR components • MS & E: muscles cells burn more calories at rest than fat calories • Aerobic: raise BMR and burns calories; more effective than MS & E training • Flexibility: less prone to injury when doing aerobic activity and strength and endurance training • Aerobics + resistance= best management
Skinfold calipers Tricep Calf Body Mass Index Under 25 considered safe =wt(kg)/ht2(m2) Waist to hip ratio Above .86 females Above .95 men Indicate higher risks Apples rather than pears Ht-wt charts Body Comp Tests
Skinfold Technique Subcutaneous Fat Layers of subcutaneous fat are measured at different sites of body to estimate total body fat levels Skin Skinfold Thickness Skin Subcutaneous Fat
Benefits of Skinfold Technique • Fairly accurate • Easy to perform • Inexpensive • Skinfold Sites for Children: tricep & calf • Not as “invasive” as adult sites
Body Composition AssessmentImplications of Results • Values are estimates (+/- 2-3% at best) • Values are personal and confidential Proper uses of results: - Serve as baseline data for repeated testing - Provide motivation for goal setting - Provide awareness about health risks
BMI • BMI = weight in pounds Ht in inches x ht in inches x 703 Advantages: • Takes little class time Disadvantage: • BMI is age and gender specific • Over-simplifies body composition
BMI Chart for children Underweight: BMI-for-age < 5th percentile Less than 18.5 Normal: BMI-for-age 5th percentile to < 85th percentile 18.5-22 At risk of overweight: BMI-for-age 85th percentile to < 95th percentile 22-25 Overweight: BMI-for-age > 95th percentile 25.1-29.9
Class Activity • Since body composition is a private matter, what would you want your students to know about this component of fitness and how would you teach it with sensitivity?