Download
1 / 12
140 likes | 322 Views
Body Composition. The body’s proportion of fat and fat free mass. Fat Free Mass. All non-fat tissue (bone, muscle, water, organs, connective tissues, teeth). Fat (adipose tissue). Essential Fat – normal body functioning Males – 3% to 5% Females – 8% to12 %

E N D
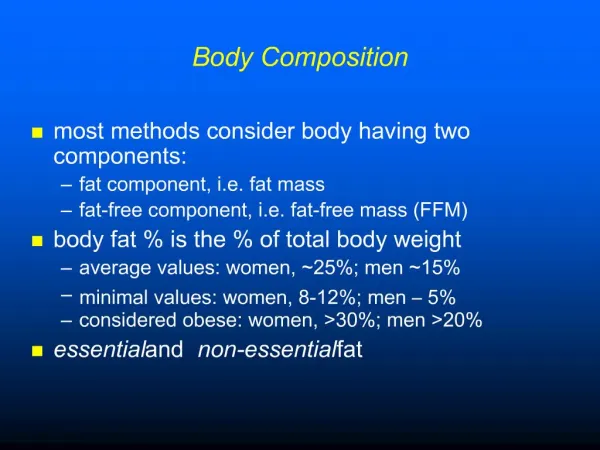
Body Composition The body’s proportion of fat and fat free mass
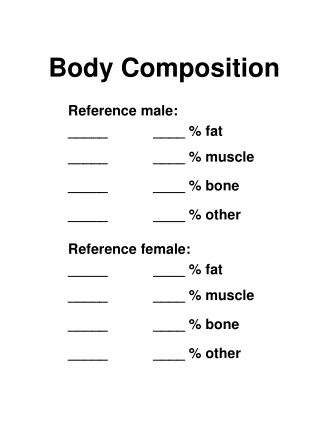
Fat Free Mass • All non-fat tissue (bone, muscle, water, organs, connective tissues, teeth)
Fat (adipose tissue) • Essential Fat – normal body functioning Males – 3% to 5% Females – 8% to12 % • Non-Essential Fat – storage of fat in adipose tissue. • _______________________ • _________________________________ • _______________________
Overweight • Body weight above recommended range for good health. • 10% above recommended range (Ht/Wt) • BMI 25 – 29.9 • __% of adult Americans are overweight
Obesity • A more serious degree of overweight causing a significant impairment of health. (Overall mortality rate ______ that of non-obese people) • 20% above recommended weight (Ht/Wt) • BMI >30 • __% of American adults are obese
Premature death Cardiovascular disease Hypertension High blood cholesterol Type II diabetes Stroke Gall bladder disease Osteoarthritis Certain cancers: - Colon - Breast - Prostate - Ovary - Cervix Obesity-Health Consequences
Percent Body Fat • The proportion of the body’s total weight that is fat. • Methods of determining % body fat • ________________________ • ________________________ • ________________________ • ________________________
Percent Body Fat Chart Males (% Fat) Females (% Fat) Rating (ages 18-30) (ages 18-30) Desirable 6-14 10-19 Acceptable 15-17 20-24 Overfat 18-19 25-29 Obese 20 or over 30 or over
Body Fat Distribution – __________ (apple shaped) • Predominantly ____ • Region – _________ • Site – ________ • Fat cell size – _____ • Fat mobilization - ________
Android Distribution & Disease Android = Increased risk for cardiovascular disease and diabetes. • Easy fat mobilization = _________________ • Large fat cell size = ____________________ Android fat distribution is determined by: • W/H Ratio: Male >.94 Female >.82 • Waist Cir.: Male >40” Female >35”
Body Fat Distribution – _________ (Pear shaped) • Predominantly ________ • Region – ________ ______________ • Site – ___________ • Fat cell size – _____ • Fat mobilization - __________