Download
1 / 15
150 likes | 347 Views
Electrophoresis and Visualization. SDS-Page Part II. Boiling Lysates. Proteins are being denatured by the combination of SDS and heat. Resultant proteins take on a rod-like shape and a uniform negative charge-to-mass ratio proportional to their molecular weight. Electrophoresis.

E N D
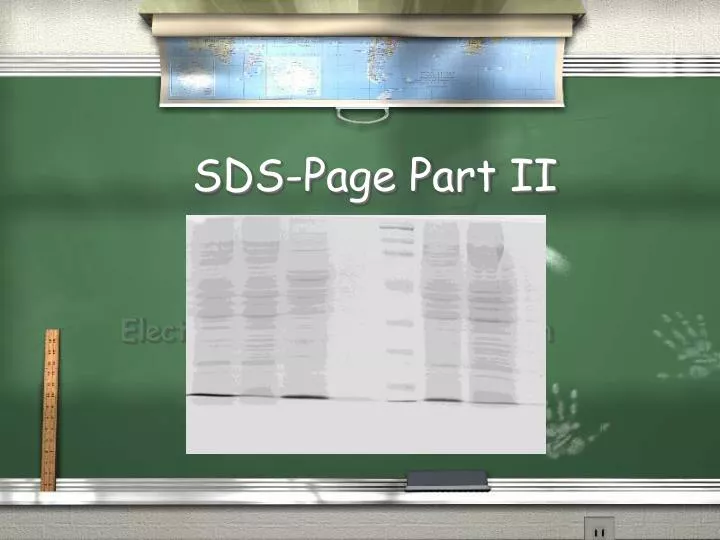
Electrophoresis and Visualization SDS-Page Part II
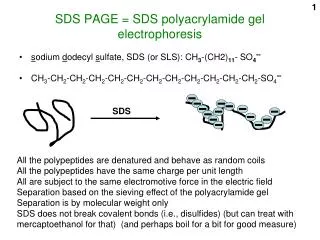
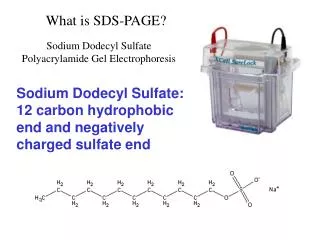
Boiling Lysates Proteins are being denatured by the combination of SDS and heat Resultant proteins take on a rod-like shape and a uniform negative charge-to-mass ratio proportional to their molecular weight
Electrophoresis • Use polyacrylamide gel • Stacking gel- Large pore size and stacks proteins • Separating gel- Small pore size and Separates proteins base on molecular weight • Why acrylamide? • Acrylamide gel: tight matrix that is ideal for protein separation • Smaller pore size than agarose • Proteins are much smaller than intact chromosomal DNA
How does an SDS-PAGE gel work? • Negatively charged proteins move to the positive electrode • Smaller proteins move faster • Proteins separate by size
s-s SDS, heat - + proteins with SDS
Tracking the samples • You will monitor the progress of electrophoresis to ensure your samples don’t run off the gel • Using Bromophenol Blue that is in the sample buffer Refer to next slide What is in the sample Buffer?*Tris buffer to provide appropriate pH*SDS (sodium dodecyl sulphate)detergent to dissolve proteins and give them a negative charge*Glycerol to make samples sink into wells*Bromophenol Blue dye to visualize samples
Visualizing • When electrophoresis is complete, you will stain with Coomassie Blue and Destain • The stain and destain contains methanol and acetic acid that helps to fix the proteins in the gel. • Coomassie Blue binds to proteins
What next? Obtain information about the marker Obtain a picture of your gel
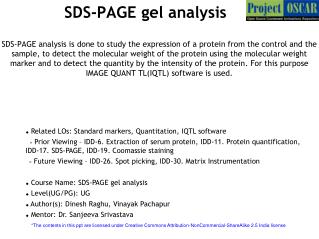
Calculate Rf Value and Graph Dye front
Calculating Rf values • Calculating Rf values Rf = distance migrated by the molecule distance migrated by the dye front • Plot a standard curve on a log graph paper or regular graph paper. • You must convert to log10(MW of proteins in the marker if you use regular graph paper) • Use your curve in the identifying the unknown and answer the questions in your lab manual
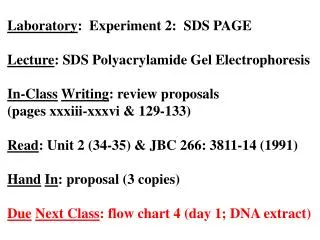
kDa Rf 203 8.5 135 12.0 86 18.5 41 28.0 33 34.0 19 41.5 8 44.5
Caution • Sample buffer waste-contains a hazardous reducing agent, Beta mercaptoethanol -stinks like rotten eggs • Eppendorf tubes should be thrown into the sample buffer waste container
Lab summary Don’t forget to include the protocol from Part I! Answer all the questions Make sure to include tables (of both the standard measurements and unknown measurements) and your graph! Conclusions?