Download

1 / 13
140 likes | 277 Views
Cryosphere Applications of Scatterometer Data. David Long Boulder, Co 7 Oct 2013. Cryosphere Applications. Sea-ice extent Operationally deployed for QuikSCAT, OSCAT, ASCAT Sea-ice age Demonstrated Sea ice motion (tracking) Demonstrated Freeze-thaw state & melt onset Demonstrated

E N D
CryosphereApplicationsof ScatterometerData David Long Boulder, Co 7 Oct 2013
Cryosphere Applications • Sea-ice extent • Operationally deployed for QuikSCAT, OSCAT, ASCAT • Sea-ice age • Demonstrated • Sea ice motion (tracking) • Demonstrated • Freeze-thaw state & melt onset • Demonstrated • C-band operational • Natural hazards: iceberg tracking • Operationally deployed for QuikSCAT, OSCAT, ASCAT
Measurement Requirements Sampling Once per day minimum, twice or more preferred < 10 km resolution Latitudes 55° to 90° Sigma-0 precision Long-term stability: <0.1 dB Short-term stability: <0.2 dB Incidence angle Wide diversity useful for discriminating ice characteristics Can use high (>50°) incidence effectively) Polarization Dual-pol
Enhanced ResolutionASCAT & QuikSCAT Enhanced resolution false color image using a single day (JD 217, 2008) of data from Ku-band QuikSCAT and C-band ASCAT. Red: QuikSCAT h-pol soat 46º Green: QuikSCAT v-pol soat 45º Blue: ASCAT v-pol soat 40º Open ocean is blue/green. Dark purple is young first year sea ice. Older first year and multi-year sea ice are yellow/gold. Glacial ice that has melted/refrozen is white, with unmodified firn showing as browns and golds. Icebergs show up a as white. Dual-frequency offers more discrimination capability than single frequency
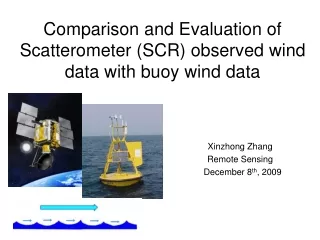
Iceberg Tracking Icebergs in radar images Contrast between ice & ocean Not affected by illumination or cloud cover BYU computer code used at the National Ice Center for iceberg tracking BYU has world’s largest iceberg tracking database
Icebergs Increasing? Much of the apparent NIC increase is an artifact of better iceberg tracking technology Recent calvings of Ross and Ronne Ice shelves are within the range of expected variation Major iceberg calving events National Ice Center count: lowOK Iceberg Count First radar observations 1985 1990 1995 2000 2005 2010 1980 Year
ArcticSea Ice Sea ice mapping vital for shipping & climate studies Higher resolution than radiometer data Operational use (NOAA/NIC) year day
Temporal Trends in Multi-Year Sea Ice Ku-band backscatter is strongly sensitivity to Has proven useful in mapping sea ice age Distinction between ice types is related to Ice salinity Porosity Surface roughness Ridge structure Daily backscatter histogram MY Ice FY Ice FY Ice MY Ice Winter 2006-2007 A.M. Swan and D.G. Long, “Multi-Year Arctic Sea Ice Classification Using QuikSCAT,” IEEE Transactions on Geoscience and Remote Sensing, Vol. 50, No. 9, pp. 3317-3326, 2012. QuikSCAT VV (σ0 in dB)
Ku-bandMulti-year Sea Ice Trends Distributions in (a) are approximately bimodal There is a shift in the modes of FY and MY ice Total area of ice in (b) is similar each winter Conclude that FY ice is replacing MY ice (a) (b) Multi year ice First year ice
C-band Sea Ice Age Timeseries Deficit of old ice in ‘94, ‘95, ‘96. Thin ice originating along Sib. Shelf causes bimodal pdf in 1996 Gyre reversal compresses newly grown lead ice into thick FY. +3.96 NAO Index +3.03 +3.28 +2.8 +2.67 +1.7 +0.72 -0.2 -3.78 Thin ice from Laptev Sea
Dual Frequency Scatterometry Single day (JD 217, 2008) false color enhanced resolution image of Greenland from QuikSCAT and ASCAT Red: QuikSCAT h-pol Green: QuikSCAT v-pol Blue: ASCAT v-pol Purple corresponds to land. Summer melt on the ice sheet periphery is the darker region between the white and purple regions. Refrozen melt-zone is bright white. Unmelted firn in central Greenland is brown and gold (Texturing in the lower left portion of the melt zone is an artifact of the diurnal melt cycle due to using passes at different times of the day) Combined, the two scatterometers offer more discrimination capability than either alone Greenland
Greenland Ice Sheet Summer melt - dramatic impact on backscatter of entire ice sheet Integrative effect: Summer melting Builds more and more buried ice lenses