Download
1 / 16
170 likes | 326 Views
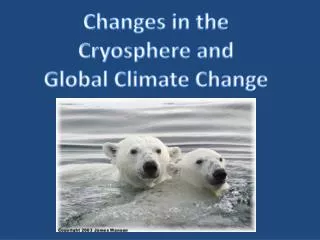
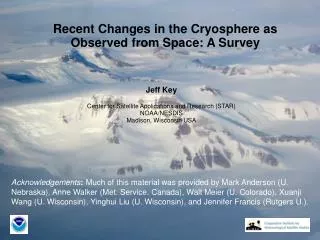
CRYOSPHERE CHANGES. These slides show photographs and images so that you can learn about how the cryosphere is being affected by climate change today.

E N D
CRYOSPHERE CHANGES • These slides show photographs and images so that you can learn about how the cryosphere is being affected by climate change today. • You can refresh your knowledge of what is meant by the ‘cryosphere’ by visiting the Discovering The Arctic website: http://www.discoveringthearctic.org.uk/9_what.html
Collapse of West Antarctic ice shelves: Larsen B, bigger than the US state of Rhode Island (or Cornwall), disintegrated in 2002. Satellite image http://commons.wikimedia.org/wiki/File:Larsen_B_Collapse_Size_Comparison.png Robert A. Rohde See the next slide for the former location of this ice shelf.
NASA satellite infrared sensor data: this shows the pattern of warming across the snow, ice, and sea surfaces in the Antarctic region from 1981 to 2007. http://commons.wikimedia.org/wiki/File:Antarctic_Temperature_Trend_1981-2007.jpg
The ‘0’ here refers to the average temperature over the time of recordings. http://scienceblogs.com/significantfigures/index.php/2013/04/02/three-iconic-graphs-showing-the-climate-fix-were-in/ 20th century global average temperature rise of about 0.7ºC. In parts of West Antarctica and the Arctic, temperature has risen by over 3°C in the last 50 years.
Each year Arctic sea ice reaches its lowest extent in September (by end of the summer). Notice how this trend compares with the temperature trend in the previous slide. http://nsidc.org/arcticseaicenews/2013/10/
The white area of the map shows Arctic sea ice extent in September 2013. The magenta line around it shows the 1981 to 2010 median. http://commons.wikimedia.org/wiki/File:Arctic_ice.jpg?uselang=en-gb Patrick Kelley Photo showing break up of sea ice. North Pole Greenland ice sheet http://nsidc.org/arcticseaicenews/2013/10/
In addition to becoming less extensive, Arctic sea ice has become thinner and will continue to thin this century. http://commons.wikimedia.org/wiki/File:Arctic_Ice_Thickness.png?uselang=en-gb NOAA image
View of Mont Blanc, near Chamonix, France. Since AD 1850 the total area of the Alps covered by glacier ice has halved. http://commons.wikimedia.org/wiki/Chamonix#mediaviewer/File:Mont_Blanc_100_0068.JPG (Daniel D.)
Melting glacier images 1938-2009 comparison: Grinnell Glacier, Montana, USA. http://commons.wikimedia.org/wiki/File:Grinnell_Glacier_1938-2009.jpg?uselang=en-gb (T.J.Hileman 1938, Lindsey Bengtson 2009)
Melting glacier images Interior of Greenland is on this side. NASA image The sea is on this side. Retreat of the calving edge of the Jakobshaven outlet glacier, Greenland, between 1851 and 2006. http://commons.wikimedia.org/wiki/File:Jakobshavn_retreat-1851-2006.jpg?uselang=en-gb
Melting glacier images 1941-2004 comparison: Glacier Bay National Park and Reserve's White Thunder Ridge (Alaska) as seen on August 13, 1941 (left) and August 31, 2004 (right). Muir Glacier has retreated out of the field of view, Riggs Glacier has thinned and retreated significantly, and dense new vegetation has appeared. Muir Glacier was more than 2,000 feet thick in 1941. 2004 USGS photo by B. F. Molnia; 1941 photo by W. O. Field. http://nsidc.org/cryosphere/sotc/glacier_balance.html
Melting glacier images Kenai Fjords National Park, Alaska. This glacier still exists but has retreated 20 km back from the 1909 position and is out of view in the 2004 photo. http://commons.wikimedia.org/wiki/File:McCarty_Glacier.jpg?uselang=en-gb Ulysses S. Grant 1909, Bruce Molnia, 2004)
Melting glacier images http://commons.wikimedia.org/wiki/File:Snow_and_Ice_on_Kilimanjaro-1993.jpg?uselang=en-gb http://commons.wikimedia.org/wiki/File:Snow_and_Ice_on_Kilimanjaro-2000.jpg?uselang=en-gb 1993-2000 comparison: Over 80% of the ice and snow on Mount Kilimanjaro, Tanzania, has disappeared over the past century, much of it in the past few decades (NASA Landsat 5 images).
This map shows changes to glacier mass balance in mountain regions between 1970 and 2004. Notice the anomaly of Scandinavia which has some glaciers that thickened during the time period of measurement. 83% of the surveyed glaciers showed thinning. New Zealand http://commons.wikimedia.org/wiki/File:Glacier_Mass_Balance_Map.png (Robert A. Rohde)
Map of temperature rise across Antarctica from 1957 to 2006. East Antarctic ice sheet West Antarctic ice sheet http://commons.wikimedia.org/wiki/File:AntarcticaTemps_1957-2006.jpg?uselang=en-gb NASA image Notice from the colour difference how West Antarctica is being affected by more warming than East Antarctica. Much of East Antarctica has experienced little, if any, change.
Some clues for understanding why the West Antarctic ice sheet is more sensitive to climate change than the East Antarctic ice sheet • The East Antarctic Ice Sheet (EAIS) has about 9 times the volume of the West Antarctic Ice Sheet (WAIS) • The EAIS has an average thickness of 2,226 metres compared with the WAIS maximum of 1,306 metres. • The EAIS reaches a higher elevation above sea level (over 4,000 metres) than the WAIS. • In contrast with East Antarctica, the WAIS sits on bedrock that is mostly below sea level.