Download
1 / 42
530 likes | 899 Views
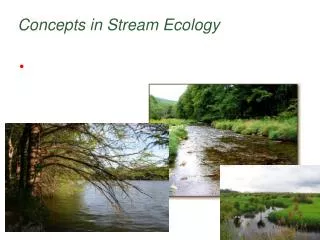
What is a watershed? Who measures watersheds? What is measured in watersheds and why? How are watersheds measured? How are streams measured?. Stream and Watershed Ecology. Ecology is the interaction of the biotic (living) environment and the abiotic (non-living) environment

E N D
What is a watershed?Who measures watersheds? What is measured in watersheds and why?How are watersheds measured?How are streams measured?
Stream and Watershed Ecology • Ecology is the interaction of the biotic (living) environment and the abiotic (non-living) environment • In this module we will learn about important stream habitat-forming processes and how to do a quick assessment of these processes. • More specifically students will learn: • what a watershed is, • who typically collects data, • what kinds of data are typically collected • how to collect some types of data
What is a watershed? • The land area that drains into a selected stream or water body • Can by very small or very large • Called catchments in the rest of the world • Usually based on surface topography- subsurface features may not mimic surface ones as far as drainage is concerned
Who measures water and watersheds? USGS- US Geological Survey USBoR – US Bureau of Reclamation USACOE – US Army Corp of Engineers USFS – US Forest Service NRCS – National Resources Conservation Service USEPA – US Environmental Protection Agency USFWS – US Fish and Wildlife Service NOAA – National Oceanic and Atmospheric Administration NMFS – National Marine Fisheries Service TRIBES Cities, counties, states, schools
What is measured and why? • Watershed area is of primary importance • Area is a basic piece of information that one needs for many purposes, e.g., • To assess the spatial scale of a particular watershed system • To compare watersheds • Watershed area defines the area that delivers water, sediment and nutrients to a water body
What is measured and why? • Watershed area is also used to help scientists understand important relationships between watershed size and elements within the watershed, e.g., • Trees /area • Runoff / area • Soil nutrients / area
How do we measure watershed area? Graphic method • Trace your watershed on vellum or other transparent paper • Lay the area over gridded graph paper • Count the number of vertices • Use the scale on your map to figure out how much area one square of your graph paper represents • Multiple the area of one square by the number of vertices you counted
Graphic method of measuring areaCount the vertices within the area • Each vertix represents the center of the area around it 51 vertices Scale
Other watershed area measurement methods • Can trace your watershed using a planimeter • Can use GIS or other electronic methods if you have the data layers • Can do a site survey with a level and rod
What else do we typically measure in streams and watersheds? Climate – precipitation, temperature, wind, humidity, etc. Land cover/land use Physiography – soils, geology, topography Surface and subsurface flow regime –quantity, timing
What do we want to know about precipitation? • Quantity (how much) • Intensity (how much over how long) • Temporal variation • Spatial variation
What do we typically measure in streams and watersheds? • Streamflow – quantity, timing, quality • Organic input to streams – LWD • Nutrient input to streams • Sediment input to streams • Light and heat inputs to streams • Biological communities • Channel characteristics – slope, bankfull width, substrate, pools, riffles
Bankful Width • Why is it important? • Important metric used for categorizing stream types • Riparian Management Zones (RMZ) begin at bankful channel edge • RMZ Inner Zone width is dependent on bankful width • Used to determine appropriate culvert sizing • How is it defined? • The lateral extent of the water surface required to completely fill the channel above which water would spill onto the floodplain.
Water types in Washington • S – shorelines • F – Fish bearing • Np – Non-fish bearing but perennial flow • Ns – Non-fish bearing, only seasonal flow See http://www.dnr.wa.gov/sflo/frep/watertyping/ for more information
Watershed assessment methods • Many organizations use some sort of watershed assessment technique to characterize stream systems • Each organization has slightly different procedures. • Assessment methods vary in terms of their focus • There are many examples on the web, e.g., any of the 62 Washington state WRIA (Water Resource Inventory Area) • e.g., http://www.ecy.wa.gov/apps/watersheds/wriapages/index.html
Watershed assessment methods • Hydrologic regime • Analyze flow records for changes in peak flows, flow durations, base flows, etc. • Compare flow records with precipitation data • Assess connectivity changes in watershed, e.g. dams, diversions, levees, impervious area
Watershed assessment methods • Organic matter input processes • Assess riparian and floodplain forest/vegetation conditions • Identify current and historic fire return patterns PNW data source http://pnwin.nbii.gov/firedata.html#Hist
Watershed assessment methods • Nutrient input processes • Assess background inorganic inputs based on geologic and soils maps • Assess inputs from anthropogenic sources such as dryfall and wetfall deposition, point and non-source inputs, current or former seasonal inputs such as spawning fish and leaf fall
Watershed assessment methods • Light and heat inputs • Assess current and historical shade/canopy conditions in stream and floodplain • Assess current and historic turbidity levels in streams
How do we measure how much water is in a stream? • Volumetric measurements- • Useful for very low flows; collect a known volume of water for a known period of time Volume/time is discharge or Q • Cross-section/velocity measurements • Dilution gaging with salt or dye • Artificial controls like weirs
Stream measurement methods Engineering view of a stream 1 5 V = 2 m/s A = 3 m2 n = 0.04 t = 120 N/m2 Ecological view of a stream B-IBI = 23 pH = 7.2 TDS = 110 mg/l DO = 8.3 mg/l D50 = 10 cm Adapted from Gordon et al. 1992
Discharge Measurement Slide from U. Mass. Boston
Velocity – Area Method of discharge measurement By measuring the cross-sectional area of the stream and the average stream velocity, you can compute discharge This is a continuity of mass equation Q = VA units are L3/t (volume / time) = discharge Where Q is discharge V is velocity A is cross-sectional area
Velocity – Area method of discharge measurement Tape measure- horizontal location of measures taken from tape Water surface Measurement represents mid-section of a polygon Velocity measured 0.6d from water surface (0.4d from bottom) Record x value (tape distance), y value (total depth at measurement site, and velocity at 0.6d
Mid-point method of calculating discharge (Q) Location of depth and velocity measurements Area included Area not included Key Assumption: Over estimation (area included) = Under estimation (area not included), therefore cross-section area is simply the sum of all the sections (rectangles), which is much easier than taking the integral! However, the hypotenuse of each over-under estimation triangle can be used to calculate the wetted perimeter.
How many subsections? • Subsections should be at least 0.3 feet or ~0.1 m wide • Each subsection should have 10% or less of total discharge • Number of subsections should be doable in a reasonable amount of time
Equation for computing subsection discharge - qi Equation for computing q in each subsection X = distance of each velocity point along tape Y = depth of flow where velocity is measured V = velocity Q = total discharge = sum of qi
Float method of discharge measurement • Gives good estimates when no equipment is available • Use something that floats that you can retrieve or is biodegradable if you can’t retrieve it • E.g. oranges, dried orange peels, tennis balls
Float method of velocity measurement Three people are needed to run the float test. One should be positioned upstream and the other downstream a known distance apart, one in the middle to record data. The upstream person releases the float and starts the clock and the downstream person catches the float and signals to stop the clock. The recorder writes down the time of travel of the float. Velocity is the distance traveled divided by the time it takes to travel that distance. V = distance/time You should conduct at least 3 float tests and take an average velocity. With an estimate of cross-sectional area, discharge can be computed as Q = VA where V is average velocity
Float Method surface velocity = distance / time average velocity = (0.8*surface velocity)
Channel Substrate • Substrate size (particles that line the channel) is an important component of fish and macroinvertebrate habitat • Changes in land use/land cover can change substrate size distributions • Hillslope mass movements and fluvial processes also change substrate characteristics
Substrate categories • Sand, silt, clay. <0.25" or <0.8 cm (smaller than pea size) • Gravel. 0.25" -1" or >0.8-2.5 cm (pea to golf-ball size) • Large Gravel. >1" - 3" or >2.5-7.5 cm (golf-ball to baseball size) • Small Cobble. [>3"-6" or >7.5-15 cm (baseball to cantaloupe size) • Large Cobble. >6"-12" or >15-30 cm (cantaloupe to basketball size) • Small Boulders. >12"-40" or >30cm-1.0 m (basketball to car-tire size) • Large Boulders. >40" or >1.0 m (greater than car-tire size) • Bedrock
Substrate expectations • Pools usually have finer substrates • Velocity in pools is slower and finer particles settle out • Riffles usually have coarser substrates • Velocity in riffles is faster and finer particles are swept downstream
Examples of organisms used as bioindicators Muskellunge Bull trout Stonefly Caddis fly Riffle beetle Photos from www.epa.gov/bioindicators/html/ photos_fish.html and www.epa.gov/bioindicators/ html/photos_invertebrates.html
Aquatic Invertebrates • Stream invertebrates are frequently used as bioindicators • Benthic index of biotic indicator uses numbers and species of aquatic invertebrates to assess stream condition
What will we do in the field? • Go to Tibbetts Creek at Lake Sammamish State Park: • Use float method to find stream discharge • Use current meter method to find stream discharge (total flow volume) by taking velocity cross-sections • Evaluate habitat; characterize substrate, look for aquatic insects, assess light and nutrient inputs • Everyone needs to be dressed appropriately for the weather and for standing in water