Download
1 / 38
380 likes | 464 Views
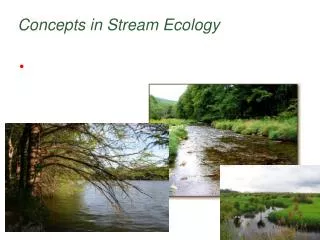
Stream Ecology II. Nutrients Bioassessment “Big Picture”. 1. Nutrients. Heterotrophs —obtain nutrients from food and ingesting/absorbing water; usually limited by C Autotrophs —often limited by macronutrients (N & P, plus K, Ca, S, Mg)

E N D
Stream Ecology II • Nutrients • Bioassessment • “Big Picture”
1. Nutrients • Heterotrophs—obtain nutrients from food and ingesting/absorbing water; usually limited by C • Autotrophs—often limited by macronutrients (N & P, plus K, Ca, S, Mg) • Often, N & P demand > availability, so nutrient supply limits biological activity
Nutrients (4) • Nitrogen • ~1 mg/L, as influenced by humans • ~0.1 mg/L, natural • 40 to 90% is DON • Phosphorus • ~0.01 mg/L for PO4-3(SRP) • ~0.025 mg/L for TDP
Nutrients (6): N Budget Nitrogen budget for agricultural fields and riparian zones associated with the Rhode River, Maryland (Peterjohn and Correll 1984). Units are kg/ha/yr.
Nutrients (8): P Budget Phosphorus budget for agricultural fields and riparian zones associated with the Rhode River, Maryland (Peterjohn and Correll 1984). Units are kg/ha/yr.
Nutrients (9) • Transport and solute dynamics closely coupled with physical movement of water • For non-reactive solutes (ignoring subsurface exchange): ΔC ΔC mixing in storage with t DS water mass C=concentration, t=time, x=distance, u=downstream velocity, D=dispersion coefficient, Cs=storage zone, =storage coefficient
Nutrients (10) • For reactive solutes (uptake and mineralization): ΔC ΔC mixing in uptake mineral. with t DS water mass C=concentration, t=time, x=distance, u=downstream velocity, D=dispersion coefficient, c=dynamic uptake rate, z=depth, b=mineralization rate, Cb=mass per unit area of immobilized nutrient in streambed
Nutrients (11): N Pristine: ~1 kg/ha-yr Human-affected: ~9.4 kg/ha-yr, with 67% as nitrate 80% of world’s variation due to fertilizers
Nutrients (12): P Pristine: ~1 kg/ha-yr Agricultural: ~2 kg/ha-yr (row crops) ~2 kg/ha-yr for MS-Atchafalaya River Basin Inputs: fertilizers, manure, and sewage sludge
Importance of Nutrients in Stream Restoration • Essential to ecologic function and integrity • Typically nutrient-limited • Pathways, budgets, and loadings are affected by human activity and corridor condition
2. Bioassessment • To assess the biological integrity and composition of stream points in relation to reference site (as defined here for use in Ohio*) • To measure river condition relative to a “reference stream” • “River health” in the very broad sense that a healthy river is one in good condition • Select examples • Index of Biotic Integrity (IBI)—fish • Invertebrate Community Index (ICI) • Qualitative Habitat Evaluation Index (QHEI)—physical characteristics *Dufour, K., M. Meehan, A. Van Kley, B. Weber, R. Will, I.Y. Yeo, with S.I. Gordon and M.M. Conroy, 2001, Development and Change in the Big Darby Watershed, City and Regional Planning Regional Planning Studio.
Index of Biotic Integrity (IBI; 1) • At a stream location, a score is given for each metric if it closely (5), somewhat (3), or fails (1) to approximate the “reference site” • With 12 metric scores, 60 is the maximum and 12 is the minimum • Total Number Species: direct diversity measure and general indicator of environmental quality • Number of Darter Species/Percent Round-Bodied Suckers: site specific species requiring clean water found in headwater or wading stream and represented by round-bodied suckers in boating sites • Number of Sunfish Species/Number of Headwater Species: favor quiet pools and in-stream cover; indicate degree of preservation of original pools and riffles and channel components • Number of Sucker Species/Number of Minnow Species: relatively long-lived and favor high environmental quality; serve as long-term indicators of surrounding conditions • Number of Intolerant Species/Number of Sensitive Species: serve as indicators of degradation; greater proportion of intolerant species indicates less degradation • Percent Tolerant Species: serves as indicator of degradation; greater proportion of tolerant species signifies a greater degree of degradation
Index of Biotic Integrity (IBI; 2) • Percent Omnivores: represents degree of disruption to the food base; greater proportion of omnivores indicates greater environmental degradation • Percent Insectivores: measures community integrity in the middle of the food chain; fewer insectivores suggest depletion of insect food base and therefore a greater degree of environmental degradation • Percent Top Carnivores/Percent Pioneering Species: measures fish species at the top of the food chain; more carnivores suggest a greater food base and therefore a relatively good community structure • Number of Individuals: excluding tolerant species, serves as a measure of toxic sensitivity and total degradation • Percent Hybrids/Number of Simple Lithophilic Species: indicate levels of stress and disturbance in stream reach; lithophilic spawners require clean gravel or cobble and are a good indicator in non-headwater streams • Percent DELT Abnormalities: measures Deformities, Eroded fins, lesions or tumors and usually indicate overcrowding, disease, or high levels of toxicity
Invertebrate Community Index (ICI; 1) • At a stream location, a score is given for each metric if it closely (6), somewhat (4), less somewhat (2), or fails (0) to approximate the “reference site” • With 10 metric scores, 60 is the maximum and 0 is the minimum • Total Number of Taxa: species richness and diversity increases with warm water stream quality; inverse relationship with drainage area • Number of Mayfly Taxa: pollution sensitive species; greater proportion of taxa indicates higher environmental quality • Number of CaddisflyTaxa: main component in larger, unimpacted waterways; wide range of pollution tolerances within taxa • Number of Fly Taxa: have wide range of tolerances to pollution; often only organism collected under heavily polluted conditions - greater proportion suggests lower stream quality • Percent Mayfly Composition: easily affected by even minor disturbances; serves as measure of overall levels of stress and disturbance
Invertebrate Community Index (ICI; 2) • Percent Caddisfly Distribution: quickly absent under environmental stress; serves as a measure of stream stress • Percent Tribe Tanytarsini Midge Composition: often predominant group at minimally impacted sites; pollution tolerances are intermediate • Percent Other Fly and Non-insect Composition: includes non-insect invertebrates such as worms, isopods, snails, etc.; main community component in poor water quality conditions - greater abundance indicates lower environmental quality • Percent Tolerant Organisms: tolerant to toxic and organic pollution; greater proportion of organisms indicates lower overall environmental quality • Number of Qualitative EPT Taxa: qualitative measure of habitat diversity and water quality; measures richness of mayfly, stonefly, and caddisfly taxa
Qualitative Habitat Evaluation Index (QHEI; 1) • Substrate: measures substrate type and quality; takes into account variables like parent material, embeddeness of cobble, gravel and boulders and silt cover. The maximum score is 20 • Instream Cover: measures instream cover type and amount. The maximum score is 20 • Channel Morphology: includes channel sinuosity, development, stability and channelization; indicates the quality of the stream channel in relation to creation and stability of the macrohabitat. The maximum score is 20 • Riparian Zone and Bank Erosion: measures floodplain quality, extent of bank erosion and the width of the riparian zone; serves as indication of the quality of the riparian buffer and floodplain vegetation. The maximum score is 10
Qualitative Habitat Evaluation Index (QHEI; 2) • Pool and Riffle Quality: component measures include overall diversity of current velocities, pool depth and morphology and riffle-run depth, substrate and substrate quality; serves as indication of the quality of the pool and riffle habitats. The maximum score is a combined 20 (12 for pool, 8 for riffle) • Map Gradient: calculation of elevation drop through sampling area; accounts for varying influence of gradient with respect to stream size. The maximum score is 10
IBI, ICI, and QHEI Application Big Darby Watershed, Ohio
Comparison of Indices Stream Visual Assessment Protocol Version 2 (USDA-NRCS), Qualitative Habitat Evaluation Index (OH EPA), Rapid Bioassessment Protocol (USEPA), and Qualitative Physical Habitat Index (USEPA); Hughes et al. (2010, JAWRA)
Importance of Bioassessment in Stream Restoration • Rather than focus on specific taxa, relatively rapid semi-quantitative protocols have been developed to comprehensively characterize the physical habitat structure of streams (Reference, and various levels of impairment) • Balance information content of candidate indicators against the costs of acquiring the information
“Big Picture” (5): Spatial Scales (Minshall, JNABS, 1988)
“Big Picture” (6): Temporal Scales (Minshall, JNABS, 1988)
“Big Picture” (9): Urban Streams (Meyer et al., JNABS, 1988)
“Big Picture” (10): Urban Stream Syndrome (Walsh, JNABS, 1988)
Importance of “Big Picture” in Stream Restoration • Appreciate connectivity and scale • Hyporheic zone • Special needs and opportunities of urban streams