Download
1 / 37
370 likes | 552 Views
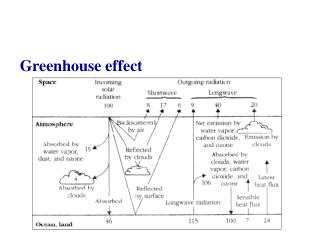
How Well Do Travel Cost Models Measure the Effect of Hospital Mergers?. Michael Doane Competition Economics LLC Luke Froeb Owen Graduate School of Business Administration Vanderbilt University Larry Van Horn Owen Graduate School of Business Administration

E N D
How Well Do Travel Cost Models Measure the Effect of Hospital Mergers? Michael Doane Competition Economics LLC Luke Froeb Owen Graduate School of Business Administration Vanderbilt University Larry Van Horn Owen Graduate School of Business Administration Institute of Medicine and Public Health Vanderbilt University
Outline of talk • Policy Background • Hospital Merger simulation shows small effects when measured in minutes of travel time • Similarly, cardiac catheterization patients are unwilling to travel more than a few minutes to get to a much lower risk hospital • Discussion
Co-authors • Michael Doane • Competition Economics LLC • Larry Van Horn • Owen Graduate School of Business Administration • Institute of Medicine and Public Health • Vanderbilt University
Number of Community Hospitals,1988 – 2008 All Hospitals Urban Hospitals Rural Hospitals (2) Source: Avalere Health analysis of American Hospital Association Annual Survey data, 2008, for community hospitals. (1) All nonfederal, short-term general, and specialty hospitals whose facilities and services are availableto the public. (2) Data on the number of urban and rural hospitals in 2004 and beyond were collected using coding different from previous years to reflect new Centers for Medicare & Medicaid Services wage area designations.
Number of Hospitals in Health Systems, 2000 – 2008 Source: Avalere Health analysis of American Hospital Association Annual Survey data, 2008, for community hospitals. (1) Hospitals that are part of a corporate body that may own and/or manage health provider facilities orhealth-related subsidiaries as well as non-health-related facilities including freestanding and/or subsidiary corporations.
Consolidation incentives are strong • Not-for-profits continue to struggle financially • Merger is a way to cut overhead, improve delivery • Push to form Accountable Care Organizations • Easier for systems to hire physicians • Increased market power of merged hospitals
US antitrust agencies resisted consolidation, but lost most of their merger challenges
The “shipments” methodology played a big role in the government losses • Shipments methodology led to big geographic markets … • … based on inpatient flow data (“Elzinga-Hogarty Test”) • Geographic extent of demand – “Little In From the Outside” (LIFO) • Geographic extent of supply – “Little Out From the Inside” (LOFI) • Market is the smallest area such that LOFI and LIFO are below, e.g., 25%
FTC’s hospital merger retrospectives • In 2002, Chairman Muris announces studies of consummated hospital mergers • 20% price increase found for Evanston • Leads to merger challenge (2004), and relief • Trial discredits “shipments” test • Role of physician consolidation? • What about the other retrospectives? • Rise of “antitrust trolls?”
Post-Evanston: How should we evaluate hospital mergers? • Policy vacuum created by demise of “shipments tests” filled by “hospital merger simulation” • Measures competition between hospitals to get into favored tiers in payer networks • Value of system to network is estimated by travel-cost models of patient demand • Methodology results in smaller markets (4 vs. 10 hospitals)
How can mergers create market power? • Big idea: payers create competition among hospitals by threatening to “steer” patients to hospitals with lower prices • Mergers can eliminate this competition. • Bargaining theory: If the merger can make payers more eager to reach agreement (by making the alternative worse) then merger can create market power.
FTC uses model to estimate increased bargaining power of merged hospital
Post-Evanston FTC Enforcement • 2006 Inova/PWHS • FTC challenged, merged share >73% in Northern Virginia • 2010 UHS/PSI • Divestitures in a few isolated markets: Las Vegas, Delaware, and Puerto Rico
How Does Hospital Merger Simulation Work? Four-Step Process: • Estimate Hospital Choice Model using “travel time” as a proxy for the “price” that patients “pay” • Hospitals’ bargaining power is measured by patient’s willingness to pay (WTP) for inclusion into network, measured in minutes of travel time. • Estimate relationship between hospital WTP and negotiated prices (Price Model) • Use Price Model to simulate price effect of proposed merger given predicted change in WTP.
Example: Hypothetical Merger • Hypothetical merger of Univ. of PA Health System (3 hospitals) and Thomas Jefferson Hospital in Philadelphia • Data Source: Pennsylvania “all-payer” data set • Calendar Year 2008 • Commercial inpatients only • Treatment for primary Major Diagnoses Category (“MDC”) • 371,570 inpatients
Step 1: Estimate Hospital Demand • Measure patients’ demand for hospitals as a function of • Travel time (minutes) • Hospital quality (nursing intensity, teaching status, etc.) • Inpatient demographics (age, income, etc.) • Assumes patients choose hospital that gives them the highest utility
Hospital Choices Vary by Zip Code Univ of PA Zip Code 1 Zip Code 3 Thomas Jefferson Hospital B Hospital A Zip Code 2 Zip Code 4
Appendix A: Estimated Hospital Choice Model (see next slide)
Number of choices: 2 to 18; average: 18, Wald chi2(71) = 174,177.04 ; Prob > chi2 = 0.000 Log likelihood = -583,785.21 *** significant at 1%; significant at 5%; significant at 10%.
What do the demand estimates mean? • If inpatient passes one hospital to get to another, then value of extra quality > extra travel time • Analogy to environmental economics: • If tourist passes one lake to get to cleaner one, then value of pollution reduction > extra travel time • Compute value of pollution reduction from increased travel time @ $25/hour (i.e., opportunity cost of leisure)
Step 2: Compute patients’ willingness to pay (WTP) for each hospital • Question: what is the value of each hospital to a network? • Answer: take the hospital out of the network, and see how much patients are hurt. • This measures the bargaining power of an individual hospital
With hospital 1 in the network, this patient faces an expected travel time of 10 minutes Expected travel time for patient with three hospitals to choose from
With hospital 1 is removed from the network, this patient faces an expected travel time of 22.5 minutes Value of hospital 1 to patient is 12.5 minutes Expected travel time for a prospective inpatient when Hospital 1 is removed
Value of combined U Penn and TJ to network (measured in min. of travel time) Change in WTP: [522,291/(345,963+109,304)] -1 = 14.7%
What explains Change in WTP: Look at Patients 2nd and 3rd Choices for Hospitals?
Step 3: Estimate relationship between hospital WTP and “Prices” • Regression analysis: used to quantify relationship between negotiated per-diem prices and hospital WTP Price Price = α + β WTP + ε WTP • Negotiated prices are generally not public but are available to the FTC via 3rd-party CIDs
Step 4: Estimate merger price effect Change in WTP (%) 14.7% x Elasticity of Price with respect to WTP 0.6 = Merger Price Effect (%) 8.8%
Shipments Test implies much smaller merger effect at 85% threshold
Question: Can we accurately measure hospital demand w/travel-cost approach methodology? • Travel costs are small relative to actual costs • Insurance indemnifies patients • Can patients measure quality? • Do patients know about hospital quality? • Health care is an experience good • Decision biases surrounding of low probability of negative outcomes • Do physicians make the decision?
External validity check: How would environmental economist predict price effect of merger? 67,024 minute change in WTP ÷ 33,175 patients (=2 minutes/patient) X $25/hour = $0.84/patient of increased value Average hospital admission charge is about $10,000 Price effect < 0.01%
External validity check: how much would you pay to reduce risk of heart attack (by taking Lipitor)? • Lipitor is a blockbuster drug that reduces risk of a heart attack • Absolute risk reduction of 1% (Placebo 3% vs. Lipitor 2%) • Huge Demand (> 12 $billion in sales)
External validity check (cont.): how much would you pay to reduce risk of heart attack (by travelling further)? • Heart catheterization mortality rates vary across hospitals from 0% to 9% • Model says that an absolute risk reduction of 1% is worth only 3 minutes of travel time! • Same risk reduction as Lipitor • Estimated from hospital choice model on 1,477 commercial inpatients in Philadelphia area in 2008