Download

1 / 40
420 likes | 1.33k Views
Vertical and Horizontal Integration. Mergers. Vertical Integration. Vertical relationships: relations between firms involved in sequential steps of production Example: Upstream firm Wholesaler Downstream firm Retailer Intermediate good Subcontractor

E N D
Vertical Integration Vertical relationships: relations between firms involved in sequential steps of production Example: Upstream firm Wholesaler Downstream firm Retailer Intermediate good Subcontractor Final good General contractor Vertical Integration: organization of more than one sequential stages of production within one firm Firms integrate or not “make or buy” decision
Why integrate? • Eliminate Transaction costs • Contracting costs • Opportunities for “holdup”=opportunism* by one party to a relationship when other party is in a weak bargaining position (e.g. auto manufacturer buys parts from specialized parts supplier. Key: part supplier has invested in “relationship-specific capital”) *It makes sense in asymmetric info. Otherwise you can write down everything (for every possible contingency in the contract) • Coordinate production • Physical condition issues • Avoid inventory costs (“just in time production”) • Exert markets power in the downstream market
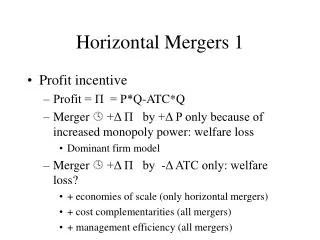
Vertical restraints • Restriction by upstream firm on behavior of downstream firms • Motivation for vertical restraints: • Vertical externalities • Double marginalization problem • Vertical service externality (part of the benefit of providing good service goes to manufacturer) • Horizontal externalities • Horizontal price externality (usual oligopoly competition) • Horizontal service externality (e.g. high street store with trained sales staff, customers come and check out product, but buy online)
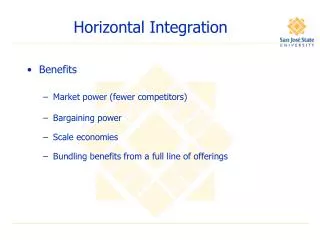
Horizontal mergers • Mergers of competitors • Unilateral Effects (as opposed to Coordinate Effects): Concerned with effects of changing market shares on price and welfare • Antitrust (Competition) Policy in the EU and the US
Introduction • Technical progress is the source of rising living standards over time • Introduces new concept of efficiency • Static efficiency—traditional allocation of resources to produce existing goods and services so as to maximize surplus and minimize deadweight loss • Dynamic efficiency—creation of new goods and services to raise potential surplus over time
Introduction 2 • Schumpeterian hypotheses (conflict between static and dynamic efficiency) • Concentrated industries do more research and development of new goods and services, i.e., are more dynamically efficient, than competitively structured industries • Large firms do more research & development than small firms
A Taxonomy of Innovations Product versus Process Innovations • Product Innovations refer to the creation of new goods and new services, e.g., DVD’s, PDA’s, and cell phones • Process Innovations refer to the development of new technologies for producing goods or new ways of delivering services, e.g., robotics and CAD/CAM technology • We mainly focus on process or cost-savings innovations but the lines of distinction are blurred—a new product can be the means of implementing a new process
A Taxonomy of Innovations 2 Drastic versus Non-Drastic Innovations • Process innovations have two further categories • Drastic innovations have such great cost savings that they permit the innovator to price as an unconstrained monopolist • Non-drastic innovations give the innovator a cost advantage but not unconstrained monopoly power
Drastic versus Non-Drastic Innovations • Suppose that demand is given by: P = 120 – Q and all firms have constant marginal cost of c = $80 • Let one firm have innovation that lowers cost to cM = $20 • This is a Drastic innovation. Why? • Marginal Revenue curve for monopolist is: MR= 120 – 2Q • If cM = $20, optimal monopoly output is: QM = 70 and PM= $70 • Innovator can charge optimal monopoly price ($70) and still undercut rivals whose unit cost is $80
Drastic versus Non-Drastic Innovations 2 • Now consider the case if cost fell only to $60, innovation is Non-drastic • Marginal Revenue curve again is: MR = 120 = 2Q • Optimal Monopoly output and price: QM = 30; PM = $90 • However, innovator cannot charge $90 because rivals have unit cost of $80 and could under price it • Innovator cannot act as an unconstrained monopolist • Best innovator can do is to set price of $80 (or just under) and supply all 40 units demanded.
Drastic vs. Non-Drastic Innovations 3 Innovation is drastic if monopoly output QMat MR = new marginal c’ exceeds the competitive output QC at old marginal cost c $/unit = p $/unit = p Drastic Innovation: QM > QC so innovator can charge monopoly price PMwithout constraint NonDrastic Innovation: QM < QC so innovator cannot charge monopoly price PMbecause rivals can undercut that price PM c c PM c’ Demand Demand c’ MR MR Quantity Quantity QC QM QM QC
Innovation and Market Structure • Arrow’s (1962) analysis— • Innovative activity likely to be too little because innovators consider only monopoly profit that the innovation brings and not the additional consumer surplus • Monopoly provides less incentive to innovate that competitive industry because of the Replacement Effect • Assume demand is: P= 120 – Q; MC= $80. Q is initially 40. Innovator lowers cost to $60 and can sell all 40 units at P = $80. • Profit Gain is $800–Less than Social Gain $/unit Initial Surplus is Yellow Triangle--Social Gains from Innovation are Areas A ($800) and B ($200) But Innovator Only Considers Profit Area A ($800) 120 80 A B 60 Quantity 40 60 120
Innovation and Market Structure 2 • Now consider innovation when market structure is monopoly • Initially, the monopolist produces where MC = MR = $80 at Q = 20 and P = $100, and earns profit (Area C) of $400 • Innovation allows monopolist to produce where MC = MR = $60 at Q= 30 and P = $90 and earn profit of $900 • But this is a gain of only $500 over initial profit due to Replacement Effect—new profits destroy old profits $/unit 120 100 Monopolist Initially Earns Profit C—With Innovation it Earns Profit A—Net Profit Gain is Area A – Area C Which is Less than the Gain to a Competitive Firm C 90 A 80 60 Demand MR 20 30 60 120 Quantity
Innovation and Market Structure 3 • Preserving Monopoly Profit--the Efficiency Effect • Previous Result would be different if monopolist had to worry about entrant using innovation • Assume Cournot competition and that entrant can only enter if it has lower cost, i.e., if it uses the innovation • If Monopolist uses innovation, entrant cannot enter and monopolist earns $900 in profit • If Monopolist does not use innovation, entrant can enter as low-cost firm in a duopoly • Entrant earns profit of $711 • Incumbent earns profit of $44 • Gain from innovation now is no longer $900 - $400 = $500 but $900 - $44 = $856 • Monopolist always has more to gain from innovation than does entrant—this is the Efficiency Effect
Introduction • Advertising is a weapon in the competition between firms • Creating & securing a brand identity can be helpful to consumers • Consumers may have a taste for variety; each consumer may like a different version of a particular product • Advertising can match consumers with the version they most prefer • But advertising can also be an uninformative and wasteful form of competition • Evaluation of advertising’s competitive role requires an understanding or clear model of how advertising works • Consider a simple model where firms can either spend a little or a lot on advertising • If advertising by one firm largely cancels the advertising of its rival, then this can result in an “advertising” war with both firms spending excessively on advertising
Nash Equilibrium is for both firms to choose the high level of advertising expenditures. This does not maximize their joint profit. Each firm’s advertising undoes the promotional efforts of its rival. The result is excessive advertising that largely cancels itself out with little gain to consumers and lower profit for firms Advertising as Wasteful Competition Example of a Wasteful Advertising War Gamma Low Advertising Expenditure High Advertising Expenditure Low Advertising Expenditure $450, $450 $375, $500 ZIP High Advertising Expenditure $500, $375 $400,$400
Advertising, Information, & Product Differentiation • Recall the Hotelling Model (Chapter 10) • N Consumers distributed uniformly along a line • Two firms—one at each end of the line Firm X Firm Y – Each consumer is willing to pay V for the basic product – But consumers incur “transport” cost of t per unit of distance traveled to firm – Equilibrium prices (with the entire market being served): p1 = p2 = c + t
Advertising, Information,Product Differentiation 2 • Now apply Grossman and Shapiro (1984) approach: • Each firm chooses advertising expenses aimed at reaching the fraction Xor Yof the N consumers • From perspective of firm X, a fraction X(1 - Y)(indicatedby “x”)of consumers will know of its product only and a fraction X Y(indicated by *) will know of both X and Y * x * x x * x x x * Firm X Firm Y – Firm X is a monopoly with respect to the uniform but less dense population of X (1 - X)N consumers who know only X –Assume that equilibrium pX is low enough that all of these buy 1 unit of X Firm X Firm Y
Advertising, Information, Product Differentiation 3 • Firm X competes with Firm Y for the also less dense but uniform population of XY who know of both goods Firm X Firm Y – So, total demand facing firm X is: • Firm Y faces a similar demand • Each firm must choose • – how much advertising to do, i.e., how big should be • – What price to charge?
Advertising, Information, Product Differentiation 4 • Assume that advertising expense TAifor firm i where i equals either X or Y, depends on the total number of consumers reached as follows: Then the marginal cost of advertising TAi’ is: • Profit maximization at both firms now results in two best response functions, one for prices and one for advertising. Solving these jointly then yields the equilibrium price and advertising expenditures at each and
Advertising, Information, Product Differentiation 5 • Note that must be greater than t/2 in order to maintain our assumption that i < 1 for each firm, i.e., we must assume that advertising is a bit expensive relative to consumer taste for variety in order to have some consumers uninformed • In turn, this means that the equilibrium price is now higher than it was in our benchmark Hotelling case that assumed all consumers were perfectly informed Equilibrium PriceFully Informed CaseImperfectly Informed Case Information is costly. The cost of providing it through advertising has to be reflected in the product price.
Advertising, Information, Product Differentiation 6 • Two additional insights also follow • Advertising as the consumer taste for variety t increases. • Recall equilibrium advertising level is • This increases as t increases. • Product differentiation and advertising are positively linked NOT because advertising causes product differentiation but because specialized consumer tastes leads firms to advertise. • Profits rise as advertising becomes more costly (as rises). • Firm profitability is: • Asrises, firms do less advertising and fewer consumers know about both products softer price competition/more profits.
Building Brand Value vs Extending Brand Reach • Advertising in the Grossman and Shapiro model is pure information. This begs the question as to how advertising precisely works • Becker and Murphy (1993) argue that advertising works as a complement to the product, i.e., it enhances consumer valuation of the good or service • Two ways complementary advertising can work • Consumers prefer to purchase brands that are well known, i.e., advertising builds brand value in that consumers are willing to pay more for a well-known brand. This is close to an “advertising as persuasion” view • Advertising provides information that enhances product value, e.g., where to go for related services such as hotels advertising nearby tourist sites. Here, advertising is truly informative and works therefore to bring in new customers, that is, to extend the brand’s market reach
When Advertising Builds Brand Value it Rotates the Demand Curve up along the price axis from D1 to D2. For a monopolist, the optimal quantity does not change but the price rises. Building Value vs Extending Reach 2 When Advertising Extends the Brand’s Market Reach It rotates the demand curve out along the quantity axis from D1 to D2. For a monopolist, the optimal price does not change but the number of customers rises. $/unit = p $/unit = p P2* D2 PM P1* D2 D1 D1 Quantity Q1* Q2* Quantity QM
Building Value vs Extending Reach 3 • The evaluation of advertising efforts from a social welfare or efficiency point of view requires that we understand whether advertising predominantly builds value or extends market reach • This is even more true when we add in some competition. • When there is more than one firm and advertising extends market reach advertising may well be excessive • Now advertising works by stealing customers from rivals • Much greater possibility that game is like the wasteful advertising game described at start of chapter • When advertising works to build value, excessive advertising is less likely because advertising now works to permit charging existing customers a higher price—not by taking customers from rivals.
Building Value vs Extending Reach 4 • Amount of advertising is also likely to depend critically on nature of price competition and number of firms • When price competition is naturally fierce, firms may advertise a lot to differentiate their product and soften price competition • When the number of firms is small, firms may again advertise more because most of the gains of a firm’s advertising flow to that firm itself and not to its rivals • Note the potential interaction of these two effects. • Since advertising is largely a sunk cost, the need to do a lot of advertising to soften price competition may limit the equilibrium number of firms • As number of firms falls, each one advertises more • Advertising/sales ratio may be high in concentrated industries but again causality is not from advertising to concentration • ReaLemmon Case
Cooperative Advertising • In contrast to analysis so far, much advertising and promotion is done by retailer on manufacturer’s behalf • Manufacturer and retailer may therefore wish to act cooperatively so as to avoid problems of underprovision of services discussed in Chapter 18 • Retailer may try to free ride on promotional efforts of other retailers • Retailer may substitute less-costly brands for manufacturer’s product • These cooperative arrangements take a variety of forms such as slotting fees, “pay-to-stay” fees, and failure fees • However, they all result in the manufacturer paying part of the retailer’s promotional expense
Cooperative Advertising 2 • Because cooperative advertising contracts can resolve many of the manufacturer/retailer conflicts they have the potential to promote economic welfare. • But, cooperative advertising can also be used to suppress or weaken competition • McCormick Spice may have used slotting fees to buy shelf space preemptively and foreclose it to rival spice firms • Slotting and promotional fees can be offered on different terms to retailers (price discrimination) • usually large retailers will get a quantity discount • Large retailers (WalMart, Borders) then gain competitive advantage over small ones (independent retailers and bookstores) • Slotting fees may be paid to retailer in return for keeping retail price high (Resale Price Maintenace)
Empirical Application: Information versus Prestige in Advertising • Can we devise clear empirical tests that truly identify the precise role of advertising? • Ackerberg (2001) is an effort to do just that. He looks at the impact of advertising that accompanied the introduction of a new, low-fat yogurt product by Yoplait in 1987-88. • Specifically, Ackerberg tests whether this advertising was primarily informative or instead worked by appealing to the status consciousness of the consumer
Empirical Application: Information versus Prestige in Advertising 2 • The Data • In April of 1987, Yoplait made its first entry into the low-fat, low-calorie yogurt category with Yoplait 150. • This corresponds to the time period in which A. C. Nielsen collected information on about 2,000 households split between Sioux Falls, South Dakota and Springfield, Missouri • Monitors were attached to the TV’s in these households; • Scanner data was used to monitor their trips to the supermarket and what they bought
Empirical Application: Information versus Prestige in Advertising 3 • The Nielsen data cover 12 months starting three months after the April intro of Yoplait 150 • Thus these data give Ackerberg measures of the exposure of these housholds to Yoplait 150 television commercials as well as records of their Yoplait 150 purchases (if any) • In particular, Ackerberg can measure whether the consumer is a first-time or previous user of Yoplait 150 and how many ads they have seen
Empirical Application: Information versus Prestige in Advertising 4 • For each town or market, Ackerberg creates two time series from the data covering specific market days over the 12-month period • One series is the number of first-time purchases of Yoplait 150 as a fraction of the number of shopping trips that day • The other is the number of repeat purchases of Yoplait 150 as a fraction of the number of trips that day • He also has data on the Yoplait 150 price (PRICE)for each day in each market as well as for the number of television advertisements (ADS) for Yoplait 150 to which the buyer had been exposed
Empirical Application: Information versus Prestige in Advertising 5 • As a preliminary step, Ackerberg (2001) runs two separate OLS regressions First time purchases = a0 + a1PRICE + a2ADS + a3MARKET +ei Repeat purchases = b0 + b1PRICE + b2ADS + b3MARKET + ui • Here, MARKET is a dummy variable equal to 1 is the data are from Springfield but 0 if from Sioux Falls • Ackerberg’s argues that if advertising is mainly information, it will have a much bigger effect on first time buyers than on experienced ones • In other words, a2 should be larger than b2
Empirical Application: Information versus Prestige in Advertising 6 Ackerberg’s preliminary results are shown below Dependent Variable Initial Purchases Repeat Purchases Coefficient Std. Error Coefficient Std. Error PRICE -0.038 (0.013)* -0.029 (0.014)* ADS 0.030 (0.015)* 0.014 (0.017) MARKET 0.002 (0.001)* 0.006 (0.001)* *Indicates significant at the five percent level.
Empirical Application: Information versus Prestige in Advertising 7 Ackerberg’s preliminary results thus show: 1) Yoplait 150 price increases reduce demand significantly 2) Springfield consumers like Yoplait 150 more than Sioux Fall consumers 3) Advertising only raises demand significantly for first time buyer The last finding is the important one. It confirms the view that advertising is mostly informative and, in particular, informative about the product’s existence and its primary characteristics
Empirical Application: Information versus Prestige in Advertising 8 Since any purchase is a 1,0 decision, Ordinary Least Squares (OLS) is not the best estimation technique. Instead, one needs to use a probit or logit approach Also, one should in principle allow for other factors such as the price of rival yogurts. Ackerberg (2001) makes all these modifications but still finds his basic result. Advertising has by far its biggest and most statistically significant effect on first-time buyers. Advertising is primarily information