Download
1 / 74
830 likes | 1.2k Views
The COCOMO II Suite of Software Cost Estimation Models. Barry Boehm, USC COCOMO/SSCM Forum 21 Tutorial November 8, 2006. boehm@csse.usc.edu, http://csse.usc.edu/research/cocomosuite. Thanks to USC-CSSE Affiliates (33). Commercial Industry (10)

E N D
The COCOMO II Suite of Software Cost Estimation Models Barry Boehm, USC COCOMO/SSCM Forum 21 Tutorial November 8, 2006 boehm@csse.usc.edu, http://csse.usc.edu/research/cocomosuite
Thanks to USC-CSSE Affiliates (33) • Commercial Industry (10) • Cost Xpert Group, Galorath, Group Systems, IBM, Intelligent Systems, Microsoft, Motorola, Price Systems, Softstar Systems, Sun • Aerospace Industry (8) • BAE Systems, Boeing, General Dynamics, Lockheed Martin, Northrop Grumman(2), Raytheon, SAIC • Government (6) • FAA, NASA-Ames, NSF, US Army Research Labs, US Army TACOM, USAF Cost Center • FFRDC’s and Consortia (6) • Aerospace, FC-MD, IDA, JPL, SEI, SPC • International (3) • Institute of Software, Chinese Academy of Sciences, EASE (Japan), Samsung
USC-CSSE Affiliates Program • Provides priorities for, access to USC-CSE research • Scalable spiral processes, cost/schedule/quality models, requirements groupware, architecting and re-engineering tools, value-based software engineering methods. • Experience in application in DoD, NASA, industry • Affiliate community events • 14th Annual Research Review and Executive Workshop, USC Campus, February 12-15, 2007 • 11th Annual Ground Systems Architecture Workshop (with Aerospace Corp.), Manhattan Beach, CA, March 26-29, 2007 • 22nd International COCOMO/Systems and Software Cost Estimation Forum, USC Campus, October 23-26, 2007 • Synergetic with USC distance education programs • MS – Systems Architecting and Engineering • MS / Computer Science – Software Engineering
Outline • COCOMO II Overview • Motivation and Context • Model Form and Parameters • Calibration and Accuracy • Overview of Emerging Extensions • COTS Integration (COCOTS) • Quality: Delivered Defect Density (COQUALMO) • Phase Distributions (COPSEMO) • Rapid Application Development Schedule (CORADMO) • Productivity Improvement (COPROMO) • Product Line Investment (COPLIMO) • System Engineering (COSYSMO) • System of System Integration (COSOSIMO) • COCOMO II Security Extensions (COSECMO) • Network Information Protection (CONIPMO)
COCOMO Baseline Overview I Software product size estimate Software development mainten ance cost and schedule estimates Software product, process, com- puter, and personal attributes Cost, schedule, distribution by Software reuse, maintenance, and increment parameters phase, activity, increment Software organization’s Project data COCOMO recalibrated to organization’s data COCOMO
COCOMO II Book Table of Contents- Boehm, Abts, Brown, Chulani, Clark, Horowitz, Madachy, Reifer, Steece, Software Cost Estimation with COCOMO II, Prentice Hall, 2000 • 1. Introduction • 2. Model Definition • 3. Application Examples • 4. Calibration • 5. Emerging Extensions • 6. Future Trends • Appendices • Assumptions, Data Forms, User’s Manual, CD Content CD: Video tutorials, USC COCOMO II.2000, commercial tool demos, manuals, data forms, web site links, Affiliate forms
Need to ReEngineer COCOMO 81 • New software processes • New sizing phenomena • New reuse phenomena • Need to make decisions based on incomplete information
Outline • COCOMO II Overview • Motivation and Context • Model Form and Parameters • Calibration and Accuracy • Overview of Emerging Extensions • COTS Integration (COCOTS) • Quality: Delivered Defect Density (COQUALMO) • Phase Distributions (COPSEMO) • Rapid Application Development Schedule (CORADMO) • Productivity Improvement (COPROMO) • Product Line Investment (COPLIMO) • System Engineering (COSYSMO) • System of System Integration (COSOSIMO) • COCOMO II Security Extensions (COSECMO) • Network Information Protection (CONIPMO)
( ) Process Scale Factors [ ] ( ) Process Scale Factors Effort Early Design and Post-Architecture Model æ ö Environment ] [ ç ÷ · = Effort Size ç ÷ è ø Multiplier s Environment: Product, Platform, People, Project Factors Size: Nonlinear reuse and volatility effects Process: Constraint, Risk/Architecture, Team, Maturity Factors ( ) · = Schedule Multiplier
New Scaling Exponent Approach • Nominal person-months = A*(size)B • B = 0.91 + 0.01 (scale factor ratings) • - B ranges from 0.91 to 1.23 • - 5 scale factors; 6 rating levels each • Scale factors: • - Precedentedness (PREC) • - Development flexibility (FLEX) • - Architecture/ risk resolution (RESL) • - Team cohesion (TEAM) • - Process maturity (PMAT, derived from SEI CMM)
æ ö B ´ ´ Size ç EM ( ) ÷ Õ ç ÷ i ç ÷ ç ÷ è ø Scale Factors Very Low Low Nominal High Very High Extra High ( Wi ) PREC thoroughly largely somewhat generally largely familiar throughly unprecedented unprecedented unprecedented familiar familiar FLEX rigorous occasional some general some general goals relaxation relaxation conformity conformity RESL little (20%) some (40%) often (60%) generally mostly (90%) full (100%) (75%) TEAM very difficult some difficult basically largely highly seamless interactions interactions cooperative interactions cooperative cooperative interactions Project Scale Factors = PM 2.94 estimated B = 0.91 . + 0 . 01 ´ SF å i PMAT weighted sum of 18 KPA achievement levels
Nonlinear Reuse Effects Data on 2954 NASA modules [Selby, 1988] 1.0 1.0 0.70 0.75 0.55 Relative cost 0.5 Usual Linear Assumption 0.25 0.046 1.0 0.5 0.75 0.25 Amount Modified
Reuse and Reengineering Effects • Add Assessment & Assimilation increment (AA) • - Similar to conversion planning increment • Add software understanding increment (SU) • - To cover nonlinear software understanding effects • - Coupled with software unfamiliarity level (UNFM) • - Apply only if reused software is modified • Results in revised Equivalent Source Lines of Code (ESLOC) • - AAF = 0.4(DM) + 0.3 (CM) + 0.3 (IM) • - ESLOC = ASLOC[AA+AAF(1+0.02(SU)(UNFM))], • AAF < 0.5 • - ESLOC = ASLOC[AA+AAF(SU)(UNFM))], AAF > 0.5
Other Major COCOMO II Changes • Range versus point estimates • Requirements Volatility (Evolution) included in Size • Multiplicative cost driver changes - Product CD’s - Platform CD’s - Personnel CD’s - Project CD’s • Maintenance model includes SU, UNFM factors from reuse model • Applied to subset of legacy code undergoing change
COCOMO81 COCOMOII.1997 COCOMOII.2000 # Projects 63 83 161 81% 52% 64% 75% 80% Effort 61% 62% 72% 81% 65% Schedule COCOMO II Estimation Accuracy: Percentage of sample projects within 30% of actuals -Without and withcalibration to data source
COCOMO II. 2000 Productivity Ranges Scale Factor Ranges: 10, 100, 1000 KSLOC Development Flexibility (FLEX) Team Cohesion (TEAM) Develop for Reuse (RUSE) Precedentedness (PREC) Architecture and Risk Resolution (RESL) Platform Experience (PEXP) Data Base Size (DATA) Required Development Schedule (SCED) Language and Tools Experience (LTEX) Process Maturity (PMAT) Storage Constraint (STOR) Use of Software Tools (TOOL) Platform Volatility (PVOL) Applications Experience (AEXP) Multi-Site Development (SITE) Documentation Match to Life Cycle Needs (DOCU) Required Software Reliability (RELY) Personnel Continuity (PCON) Time Constraint (TIME) Programmer Capability (PCAP) Analyst Capability (ACAP) Product Complexity (CPLX) 1 1.2 1.4 1.6 1.8 2 2.2 2.4 Productivity Range
Outline • COCOMO II Overview • Motivation and Context • Model Form and Parameters • Calibration and Accuracy • Overview of Emerging Extensions • COTS Integration (COCOTS) • Quality: Delivered Defect Density (COQUALMO) • Phase Distributions (COPSEMO) • Rapid Application Development Schedule (CORADMO) • Productivity Improvement (COPROMO) • Product Line Investment (COPLIMO) • System Engineering (COSYSMO) • System of System Integration (COSOSIMO) • COCOMO II Security Extensions (COSECMO) • Network Information Protection (CONIPMO)
Status of Models Signif. Variables Data, Bayes Literature Behavior Delphi COCOMO II COCOTS COQUALMO Defects in Defects out CORADMO COSYSMO * * * * * * * * * * * * * * * * * * * * * * * >200 20 6 6 16 60
COCOMO vs. COCOTS Cost Sources STAFFING TIME
Current COQUALMO System COCOMO II Software development effort, cost and schedule estimate COQUALMO Software Size Estimate Defect Introduction Model Software platform, Project, product and personnel attributes Number of residual defects Defect density per unit of size Defect Removal Model Defect removal profile levels Automation, Reviews, Testing
Very Low Low Nominal High Very High Extra High Automated Analysis Simple compiler syntax checking Basic compiler capabilities Compiler extension Basic req. and design consistency Intermediate-level module Simple req./design More elaborate req./design Basic dist-processing Formalized specification, verification. Advanced dist-processing Peer Reviews No peer review Ad-hoc informal walk-through Well-defined preparation, review, minimal follow-up Formal review roles and Well-trained people and basic checklist Root cause analysis, formal follow Using historical data Extensive review checklist Statistical control Execution Testing and Tools No testing Ad-hoc test and debug Basic test Test criteria based on checklist Well-defined test seq. and basic test coverage tool system More advance test tools, preparation. Dist-monitoring Highly advanced tools, model-based test Defect Removal Rating Scales COCOMO II p.263
Defect Removal Estimates - Nominal Defect Introduction Rates Delivered Defects / KSLOC Composite Defect Removal Rating
Outline • COCOMO II Overview • Motivation and Context • Model Form and Parameters • Calibration and Accuracy • Overview of Emerging Extensions • COTS Integration (COCOTS) • Quality: Delivered Defect Density (COQUALMO) • Phase Distributions (COPSEMO) • Rapid Application Development Schedule (CORADMO) • Productivity Improvement (COPROMO) • Product Line Investment (COPLIMO) • System Engineering (COSYSMO) • System of System Integration (COSOSIMO) • COCOMO II Security Extensions (COSECMO) • Network Information Protection (CONIPMO)
COCOMO II RAD Extension (CORADMO) RVHL DPRS CLAB RESL COCOMO II cost drivers (except SCED) PPOS Baseline effort, schedule RCAP COCOMO II RAD Extension Language Level, experience,... Effort, schedule by stage Phase Distributions(COPSEMO) RAD effort, schedule by phase
COPROMO (Productivity) Model • Uses COCOMO II model and extensions as assessment framework • Well-calibrated to 161 projects for effort, schedule • Subset of 106 1990’s projects for current-practice baseline • Extensions for Rapid Application Development formulated • Determines impact of technology investments on model parameter settings • Uses these in models to assess impact of technology investments on cost and schedule • Effort used as a proxy for cost
The COPLIMO Model • Constructive Product Line Investment Model • Based on COCOMO II software cost model • Statistically calibrated to 161 projects, representing 18 diverse organizations • Based on standard software reuse economic terms • RCR: Relative cost of reuse • RCWR: Relative cost of writing for reuse • Avoids overestimation • Avoids RCWR for non-reused components • Adds life cycle cost savings • Provides experience-based default parameter values • Simple Excel spreadsheet model • Easy to modify, extend, interoperate
Outline • COCOMO II Overview • Motivation and Context • Model Form and Parameters • Calibration and Accuracy • Overview of Emerging Extensions • COTS Integration (COCOTS) • Quality: Delivered Defect Density (COQUALMO) • Phase Distributions (COPSEMO) • Rapid Application Development Schedule (CORADMO) • Productivity Improvement (COPROMO) • Product Line Investment (COPLIMO) • System Engineering (COSYSMO) • System of System Integration (COSOSIMO) • COCOMO II Security Extensions (COSECMO) • Network Information Protection (CONIPMO)
COCOMO II Model Differences COSYSMO • Software • Development phases • 20+ years old • 200+ calibration points • 23 Drivers • Variable granularity • 3 anchor points • Size is driven by SLOC • Systems Engineering • Entire Life Cycle • 3 years old • 60 calibration points • 18 drivers • Fixed granularity • No anchor points • Size is driven by requirements, I/F, etc
COSYSMO Operational Concept # Requirements # Interfaces # Scenarios # Algorithms + Volatility Factor Size Drivers COSYSMO Effort Effort Multipliers • Application factors • 8 factors • Team factors • 6 factors • Schedule driver Calibration WBS guided by ISO/IEC 15288
COSOSIMO Operational Concept Size Drivers • Interface-related eKSLOC • Number of logical interfaces at SoS level • Number of operational scenarios • Number of components COSOSIMO SoS Definition and Integration Effort Exponential Scale Factors • Integration simplicity • Integration risk resolution • Integration stability • Component readiness • Integration capability • Integration processes Calibration
For software developers: Source lines of code increases Effort to generate software increases Security functional requirements Security assurance requirements Effort to transition also increases More documentation Additional certification and accreditation costs For systems engineers: Effort to develop system increases Network defense requirements Network defense operational concepts Program protection requirements Anti-tamper implementation Effort to transition also increases DITSCAP and red teaming Security Impact on Engineering Effort Being addressed by COSECMO Being addressed by CONIPMO
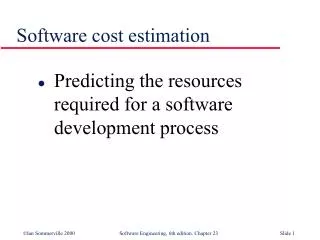
Purpose of COCOMO II • To help people reason about the • cost and schedule implications of • their software decisions
Major Decision SituationsHelped by COCOMO II • Software investment decisions • When to develop, reuse, or purchase • What legacy software to modify or phase out • Setting project budgets and schedules • Negotiating cost/schedule/performance tradeoffs • Making software risk management decisions • Making software improvement decisions • Reuse, tools, process maturity, outsourcing
Relations to MBASE*/Rational Anchor Point Milestones App. Compos. Transition Inception Elaboration, Construction LCO, LCA IOC SAT SRR PDR Waterfall Rqts. Development Prod. Des. Sys Devel Inception Phase Elaboration Construction Trans. LCA IOC LCO *MBASE: Model-Based (System) Architecting and Software Engineering
= PM Other Model Refinements • Initial Schedule Estimation ( B - ) 0 . 28 + 0 . 2 ´ 0.91 ù é ö æ % SCED ÷ ç æ ÷ ç = ´ PM ´ TDEV 3.67 ö ú ê ç ÷ ç ø è 100 è ø ú ê û ë where estimated person months excluding Schedule multiplier effects • Output Ranges Pessimistic Estimate Stage Optimistic Estimate 2.0 E Application Composition 0.50 E 1.5 E Early Design 0.67 E 1.25 E Post-Architecture 0.80 E - 80% confidence limits: 10% of time each below Optimistic, above Pessimistic - Reflect sources of uncertainty in model inputs
Outline • COCOMO II Overview • Motivation and Context • Model Form and Parameters • Calibration and Accuracy • Overview of Emerging Extensions • COTS Integration (COCOTS) • Quality: Delivered Defect Density (COQUALMO) • Phase Distributions (COPSEMO) • Rapid Application Development Schedule (CORADMO) • Productivity Improvement (COPROMO) • Product Line Investment (COPLIMO) • System Engineering (COSYSMO) • System of System Integration (COSOSIMO) • Dependability ROI (iDAVE)
Analyze existing literature Step 1 Perform Behavioral analyses Step 2 Identify relative significance Step 3 Perform expert-judgment Delphi assessment, formulate a-priori model Step 4 Gather project data Step 5 Determine Bayesian A-Posteriori model Step 6 Gather more data; refine model Step 7 USC-CSE Modeling Methodology - concurrency and feedback implied
Results of Bayesian Update: Using Prior and Sampling Information (Step 6) Language and Tool Experience (LTEX)
resolution · team cohesion · process maturity (SEI) * * * * * Product Cost Drivers RELY, DATA, CPLX RELY , DATA, CPLX , None RCPX , RUSE RELY, DATA, DOCU , = = = * RUSE CPLX , RUSE = = * Platform Cost Drivers TIME, STOR, VIRT, TURN TIME, STOR, VMVH, None Platform difficulty: PDIF TIME, STOR, PVOL(=VIRT) = VMVT, TURN * * * * Personnel Cost ACAP, AEXP, PCAP, ACAP , AEXP, PCAP , None Personnel capability and ACAP , AEXP , PCAP , = * * * * * * Drivers VEXP, LEXP VEXP, LEXP experience: PERS , PREX PEXP , LTEX , PCON = = = = = * * * * * Project Cost Drivers MODP, TOOL, SCED MODP , TOOL , SCED, None SCED, FCIL TOOL , SCED, SITE = = = SECU COCOMO Model Comparisons COCOMO Ada COCOMO COCOMO II: COCOMO II: COCOMO II: Application Composition Early Design Post-Architecture Size Delivered Source Instructions DSI or SLOC Application Points Function Points (FP) and FP and Language or SLOC (DSI) or Source Lines of Language or SLOC Code (SLOC) Reuse Equivalent SLOC = Linear Equivalent SLOC = Linear Implicit in Model Equivalent SLOC = nonlinear Equivalent SLOC = nonlinear ¦ ¦ ¦ ¦ (DM,CM,IM) (DM,CM,IM) (AA, SU,UNFM,DM,CM,IM) (AA, SU,UNFM,DM,CM,IM) Rqts. Change Requirements Volatility RVOL rating Implicit in Model Change % : RQEV RQEV rating: (RVOL) ¦ ¦ Maintenance Annual Change Traffic ACT Object Point ACT (ACT,SU,UNFM) (ACT,SU,UNFM) (ACT) = %added + %modified Scale (b) in Organic: 1.05 Semidetached: Embedded: 1.04 -1.24 1.0 .91-1.23 depending on the .91-1.23 depending on the b MM =a(Size) 1.12 Embedded: 1.20 depending on degree of: degree of: degree of: NOM · · · early risk elimination precedentedness precedentedness · · · solid architecture conformity conformity · · · stable requirements early architecture, risk early architecture, risk · resolution Ada process maturity · team cohesion · process maturity (SEI) * Different Multipliers Different Rating Scale =