Download
1 / 1
10 likes | 168 Views
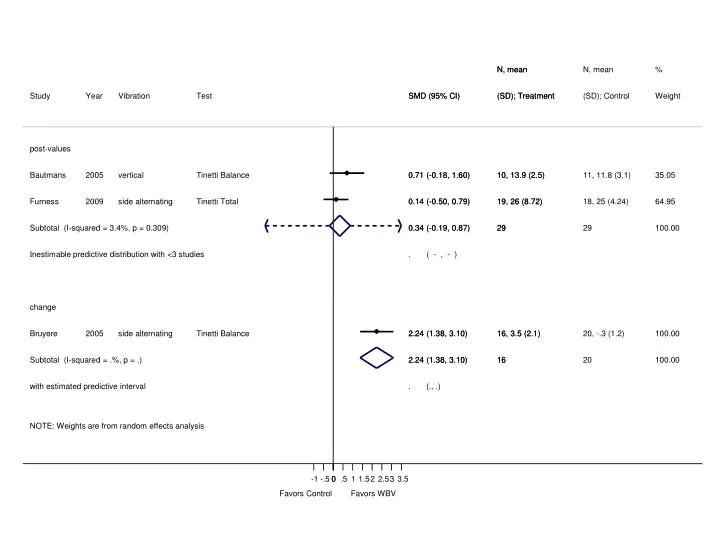
N, mean. N, mean. N, mean. %. Study. Year. Vibration. Test. SMD (95% CI). SMD (95% CI). (SD); Treatment. (SD); Treatment. (SD); Control. Weight. post-values. Bautmans. 2005. vertical. Tinetti Balance. 0.71 (-0.18, 1.60). 0.71 (-0.18, 1.60). 10, 13.9 (2.5). 10, 13.9 (2.5).

E N D
N, mean N, mean N, mean % Study Year Vibration Test SMD (95% CI) SMD (95% CI) (SD); Treatment (SD); Treatment (SD); Control Weight post-values Bautmans 2005 vertical Tinetti Balance 0.71 (-0.18, 1.60) 0.71 (-0.18, 1.60) 10, 13.9 (2.5) 10, 13.9 (2.5) 11, 11.8 (3.1) 35.05 Furness 2009 side alternating Tinetti Total 0.14 (-0.50, 0.79) 0.14 (-0.50, 0.79) 19, 26 (8.72) 19, 26 (8.72) 18, 25 (4.24) 64.95 Subtotal (I-squared = 3.4%, p = 0.309) 0.34 (-0.19, 0.87) 0.34 (-0.19, 0.87) 29 29 29 100.00 . Inestimable predictive distribution with <3 studies . ( - , - ) change Bruyere 2005 side alternating Tinetti Balance 2.24 (1.38, 3.10) 2.24 (1.38, 3.10) 16, 3.5 (2.1) 16, 3.5 (2.1) 20, -.3 (1.2) 100.00 Subtotal (I-squared = .%, p = .) 2.24 (1.38, 3.10) 2.24 (1.38, 3.10) 16 16 20 100.00 . with estimated predictive interval . (., .) NOTE: Weights are from random effects analysis -1 -.5 0 0 .5 1 1.5 2 2.5 3 3.5 Favors Control Favors WBV