Download
1 / 80
900 likes | 1.57k Views
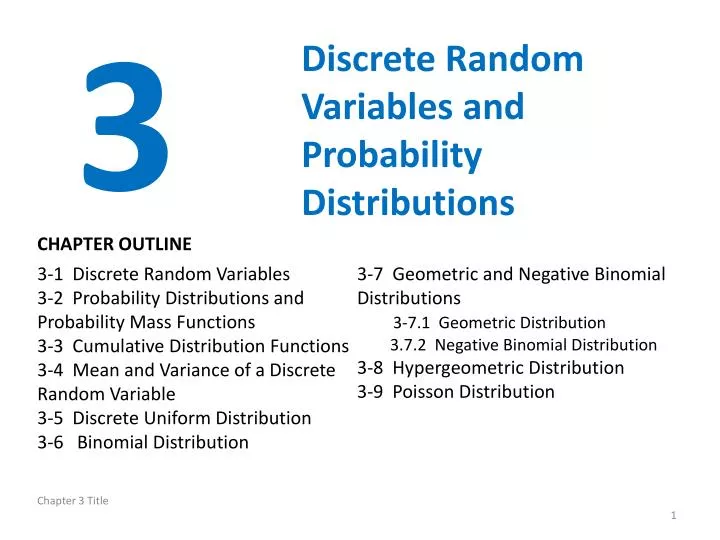
3. Discrete Random Variables and Probability Distributions. CHAPTER OUTLINE. 3-1 Discrete Random Variables 3-2 Probability Distributions and Probability Mass Functions 3-3 Cumulative Distribution Functions 3-4 Mean and Variance of a Discrete Random Variable

E N D
3 Discrete Random Variables and Probability Distributions CHAPTER OUTLINE 3-1 Discrete Random Variables 3-2 Probability Distributions and Probability Mass Functions 3-3 Cumulative Distribution Functions 3-4 Mean and Variance of a Discrete Random Variable 3-5 Discrete Uniform Distribution 3-6 Binomial Distribution 3-7 Geometric and Negative Binomial Distributions 3-7.1 Geometric Distribution 3.7.2 Negative Binomial Distribution 3-8 Hypergeometric Distribution 3-9 Poisson Distribution Chapter 3 Title
Learning Objectives of Chapter 3 After careful study of this chapter, you should be able to do the following: • Determine probabilities from probability mass functions and the reverse. • Determine probabilities from cumulative distribution functions, and cumulative distribution functions from probability mass functions and the reverse. • Determine means and variances for discrete random variables. • Understand the assumptions for each of the discrete random variables presented. • Select an appropriate discrete probability distribution to calculate probabilities in specific applications. • Calculate probabilities, and calculate means and variances, for each of the probability distributions presented. Chapter 3 Learning Objectives
Discrete Random Variables Many physical systems can be modeled by the same or similar random experiments and random variables. The distribution of the random variable involved in each of these common systems can be analyzed, and the results can be used in different applications and examples. In this chapter, we present the analysis of several random experiments and discrete random variablesthat frequently arise in applications. We often omit a discussion of the underlying sample space of the random experiment and directly describe the distribution of a particular random variable. Sec 3-1 Discrete Random Variables
Example 3-1: Voice Lines • A voice communication system for a business contains 48 external lines. At a particular time, the system is observed, and some of the lines are being used. • Let X denote the number of lines in use. Then, X can assume any of the integer values 0 through 48. • The system is observed at a random point in time. If 10 lines are in use, then x = 10. Sec 3-1 Discrete Random Variables
Example 3-2: Wafers In a semiconductor manufacturing process, 2 wafers from a lot are sampled. Each wafer is classified as pass or fail. Assume that the probability that a wafer passes is 0.8, and that wafers are independent. The sample space for the experiment and associated probabilities are shown in Table 3-1. The probability that the 1st wafer passes and the 2nd fails, denoted as pf is P(pf) = 0.8 * 0.2 = 0.16. The random variable X is defined as the number of wafers that pass. Sec 3-1 Discrete Random Variables
Example 3-3: Particles on Wafers • Define the random variable X to be the number of contamination particles on a wafer. Although wafers possess a number of characteristics, the random variable X summarizes the wafer only in terms of the number of particles. The possible values of X are the integers 0 through a very large number, so we write x ≥ 0. • We can also describe the random variable Y as the number of chips made from a wafer that fail the final test. If there can be 12 chips made from a wafer, then we write 0 ≤ y ≤ 12. (changed) Sec 3-1 Discrete Random Variables
Probability Distributions • A random variable X associates the outcomes of a random experiment to a number on the number line. • The probability distribution of the random variable X is a description of the probabilities with the possible numerical values of X. • A probability distribution of a discrete random variable can be: • A list of the possible values along with their probabilities. • A formula that is used to calculate the probability in response to an input of the random variable’s value. Sec 3-2 Probability Distributions & Probability Mass Functions
Example 3-4: Digital Channel • There is a chance that a bit transmitted through a digital transmission channel is received in error. • Let X equal the number of bits received in error of the next 4 transmitted. • The associated probability distribution of X is shown as a graph and as a table. Figure 3-1 Probability distribution for bits in error. Sec 3-2 Probability Distributions & Probability Mass Functions
Probability Mass Function Suppose a loading on a long, thin beam places mass only at discrete points. This represents a probability distribution where the beam is the number line over the range of x and the probabilities represent the mass. That’s why it is called a probability mass function. Figure 3-2 Loading at discrete points on a long, thin beam. Sec 3-2 Probability Distributions & Probability Mass Functions
Probability Mass Function Properties Sec 3-2 Probability Distributions & Probability Mass Functions
Example 3-5: Wafer Contamination • Let the random variable X denote the number of wafers that need to be analyzed to detect a large particle. Assume that the probability that a wafer contains a large particle is 0.01, and that the wafers are independent. Determine the probability distribution of X. • Let p denote a wafer for which a large particle is present & let a denote a wafer in which it is absent. • The sample space is: S = {p, ap, aap, aaap, …} • The range of the values of X is: x = 1, 2, 3, 4, … Sec 3=2 Probability Distributions & Probability Mass Functions
Cumulative Distribution Functions • Example 3-6: From Example 3.4, we can express the probability of three or fewer bits being in error, denoted as P(X ≤ 3). • The event (X ≤ 3) is the union of the mutually exclusive events: (X=0), (X=1), (X=2), (X=3). • From the table: P(X ≤ 3) = P(X=0) + P(X=1) + P(X=2) + P(X=3) = 0.9999 P(X = 3) = P(X ≤ 3) - P(X ≤ 2) = 0.0036 Sec 3-3 Cumulative Distribution Functions
Cumulative Distribution Function Properties The cumulative distribution function is built from the probability mass function and vice versa. Sec 3-3 Cumulative Distribution Functions
Example 3-7: Cumulative Distribution Function • Determine the probability mass function of X from this cumulative distribution function: Figure 3-3 Graph of the CDF Sec 3-3 Cumulative Distribution Functions
Example 3-8: Sampling without Replacement A day’s production of 850 parts contains 50 defective parts. Two parts are selected at random without replacement. Let the random variable X equal the number of defective parts in the sample. Create the CDF of X. Figure 3-4 CDF. Note that F(x) is defined for all x, - <x < , not just 0, 1 and 2. Sec 3-3 Cumulative Distribution Functions
Summary Numbers of a Probability Distribution • The mean is a measure of the center of a probability distribution. • The variance is a measure of the dispersion or variability of a probability distribution. • The standard deviation is another measure of the dispersion. It is the square root of the variance. Sec 3-4 Mean & Variance of a Discrete Random Variable
Mean Defined • The mean is the weighted average of the possible values of X, the weights being the probabilities where the beam balances. It represents the center of the distribution. It is also called the arithmetic mean. • If f(x) is the probability mass function representing the loading on a long, thin beam, then E(X) is the fulcrum or point of balance for the beam. • The mean value may, or may not, be a given value of x. Sec 3-4 Mean & Variance of a Discrete Random Variable
Variance Defined • The variance is the measure of dispersion or scatter in the possible values for X. • It is the average of the squared deviations from the distribution mean. Figure 3-5 The mean is the balance point. Distributions (a) & (b) have equal mean, but (a) has a larger variance. Sec 3-4 Mean & Variance of a Discrete Random Variable
Variance Formula Derivations The computational formula is easier to calculate manually. Sec 3-4 Mean & Variance of a Discrete Random Variable
Different Distributions Have Same Measures These measures do not uniquely identify a probability distribution – different distributions could have the same mean & variance. Figure 3-6 These probability distributions have the same mean and variance measures, but are very different in shape. Sec 3-4 Mean & Variance of a Discrete Random Variable
Exercise 3-9: Digital Channel In Exercise 3-4, there is a chance that a bit transmitted through a digital transmission channel is an error. X is the number of bits received in error of the next 4 transmitted. Use table to calculate the mean & variance. Sec 3-4 Mean & Variance of a Discrete Random Variable
Exercise 3-10 Marketing • Two new product designs are to be compared on the basis of revenue potential. Revenue from Design A is predicted to be $3 million. But for Design B, the revenue could be $7 million with probability 0.3 or only $2 million with probability 0.7. Which design is preferable? • Answer: • Let X & Y represent the revenues for products A & B. • E(X) = $3 million. V(X) = 0 because x is certain. • E(Y) = $3.5 million = 7*0.3 + 2*0.7 = 2.1 + 1.4 • V(X) = 5.25 million dollars2 or (7-3.5)2*.3 + (2-3.5)2*.7 = 3.675 + 1.575 • SD(X) = 2.29 million dollars , the square root of the variance. • Standard deviation has the same units as the mean, not the squared units of the variance. Sec 3-4 Mean & Variance of a Discrete Random Variable
Exercise 3-11: Messages The number of messages sent per hour over a computer network has the following distribution. Find the mean & standard deviation of the number of messages sent per hour. Mean = 12.5 Variance = 158.102 – 12.52 = 1.85 Standard deviation = 1.36 Note that: E(X2) ≠ [E(X)]2 Sec 3-4 Mean & Variance of a Discrete Random Variable
A Function of a Random Variable Sec 3-4 Mean & Variance of a Discrete Random Variable
Example 3-12: Digital Channel In Example 3-9, X is the number of bits in error in the next four bits transmitted. What is the expected value of the square of the number of bits in error? Sec 3-4 Mean & Variance of a Discrete Random Variable
Discrete Uniform Distribution • Simplest discrete distribution. • The random variable X assumes only a finite number of values, each with equal probability. • A random variable X has a discrete uniform distribution if each of the n values in its range, say x1, x2, …, xn, has equal probability. f(xi) = 1/n (3-5) Sec 3-5 Discrete Uniform Distribution
Example 3-13: Discrete Uniform Random Variable The first digit of a part’s serial number is equally likely to be the digits 0 through 9. If one part is selected from a large batch & X is the 1st digit of the serial number, then X has a discrete uniform distribution as shown. Figure 3-7 Probability mass function, f(x) = 1/10 for x = 0, 1, 2, …, 9 Sec 3-5 Discrete Uniform Distribution
General Discrete Uniform Distribution • Let X be a discrete uniform random variable from a to b for a < b. There are b – (a-1) values in the inclusive interval. Therefore: f(x) = 1/(b-a+1) • Its measures are: μ = E(x) = 1/(b-a) σ2 = V(x) = [(b-a+1)2–1]/12 (3-6) Note that the mean is the midpoint of a & b. Sec 3-5 Discrete Uniform Distribution
Example 3-14: Number of Voice Lines Per Example 3-1, let the random variable X denote the number of the 48 voice lines that are in use at a particular time. Assume that X is a discrete uniform random variable with a range of 0 to 48. Find E(X) & SD(X). Answer: Sec 3-5 Discrete Uniform Distribution
Example 3-15 Proportion of Voice Lines Let the random variable Y denote the proportion of the 48 voice line that are in use at a particular time & X as defined in the prior example. Then Y = X/48 is a proportion. Find E(Y) & V(Y). Answer: Sec 3-5 Discrete Uniform Distribution
Examples of Binomial Random Variables • Flip a coin 10 times. X = # heads obtained. • A worn tool produces 1% defective parts. X = # defective parts in the next 25 parts produced. • A multiple-choice test contains 10 questions, each with 4 choices, and you guess. X = # of correct answers. • Of the next 20 births, let X = # females. These are binomial experiments having the following characteristics: • Fixed number of trials (n). • Each trial is termed a success or failure. X is the # of successes. • The probability of success in each trial is constant (p). • The outcomes of successive trials are independent. Sec 3-6 Binomial Distribution
Example 3-16: Digital Channel The chance that a bit transmitted through a digital transmission channel is received in error is 0.1. Assume that the transmission trials are independent. Let X = the number of bits in error in the next 4 bits transmitted. Find P(X=2). Answer: Let E denote a bit in error Let O denote an OK bit. Sample space & x listed in table. 6 outcomes where x = 2. Prob of each is 0.12*0.92 = 0.0081 Prob(X=2) = 6*0.0081 = 0.0486 Sec 3=6 Binomial Distribution
Binomial Distribution Definition • The random variable X that equals the number of trials that result in a success is a binomial random variable with parameters 0 < p < 1 and n = 0, 1, .... • The probability mass function is: • Based on the binomial expansion: Sec 3=6 Binomial Distribution
Binomial Distribution Shapes Figure 3-8 Binomial Distributions for selected values of n and p. Distribution (a) is symmetrical, while distributions (b) are skewed. The skew is right if p is small. Sec 3=6 Binomial Distribution
Example 3-17: Binomial Coefficients Sec 3=6 Binomial Distribution
Exercise 3-18: Organic Pollution-1 Each sample of water has a 10% chance of containing a particular organic pollutant. Assume that the samples are independent with regard to the presence of the pollutant. Find the probability that, in the next 18 samples, exactly 2 contain the pollutant. Answer: Let X denote the number of samples that contain the pollutant in the next 18 samples analyzed. Then X is a binomial random variable with p = 0.1 and n = 18 Sec 3=6 Binomial Distribution
Exercise 3-18: Organic Pollution-2 Determine the probability that at least 4 samples contain the pollutant. Answer: Sec 3=6 Binomial Distribution
Exercise 3-18: Organic Pollution-3 Now determine the probability that 3 ≤ X ≤ 7. Answer: Appendix A, Table II (pg. 705) is a cumulative binomial table for selected values of p and n. Sec 3=6 Binomial Distribution
Binomial Mean and Variance If X is a binomial random variable with parameters p and n, μ = E(X) = np and σ2 = V(X) = np(1-p) (3-8) Sec 3=6 Binomial Distribution
Example 3-19: For the number of transmitted bit received in error in Example 3-16, n = 4 and p = 0.1. Find the mean and variance of the binomial random variable. Answer: μ = E(X) = np = 4*0.1 = 0,4 σ2 = V(X) = np(1-p) = 4*0.1*0.9 = 3.6 σ = SD(X) = 1.9 Sec 3=6 Binomial Distribution
Example 3-20: New Idea The probability that a bit, sent through a digital transmission channel, is received in error is 0.1. Assume that the transmissions are independent. Let X denote the number of bits transmitted until the 1st error. P(X=5) is the probability that the 1st four bits are transmitted correctly and the 5th bit is in error. P(X=5) = P(OOOOE) = 0.940.1 = 0.0656. x is the total number of bits sent. This illustrates the geometric distribution. Sec 3-7 Geometric & Negative Binomial Distributions
Geometric Distribution • Similar to the binomial distribution – a series of Bernoulli trials with fixed parameter p. • Binomial distribution has: • Fixed number of trials. • Random number of successes. • Geometric distribution has reversed roles: • Random number of trials. • Fixed number of successes, in this case 1. • f(x) = p(1-p)x-1where: (3-9) • x = 1, 2, … , the number of failures until the 1st success. • 0 < p < 1, the probability of success. Sec 3-7 Geometric & Negative Binomial Distributions
Geometric Graphs Figure 3-9 Geometric distributions for parameter p values of 0.1 and 0.9. The graphs coincide at x = 2. Sec 3-7 Geometric & Negative Binomial Distributions
Example 3.21: Geometric Problem The probability that a wafer contains a large particle of contamination is 0.01. Assume that the wafers are independent. What is the probability that exactly 125 wafers need to be analyzed before a particle is detected? Answer: Let X denote the number of samples analyzed until a large particle is detected. Then X is a geometric random variable with parameter p = 0.01. P(X=125) = (0.99)124(0.01) = 0.00288. Sec 3-7 Geometric & Negative Binomial Distributions
Geometric Mean & Variance • If X is a geometric random variable with parameter p, Sec 3-7 Geometric & Negative Binomial Distributions
Exercise 3-22: Geometric Problem Consider the transmission of bits in Exercise 3-20. Here, p = 0.1. Find the mean and standard deviation. Answer: Mean = μ = E(X) = 1 / p = 1 / 0.1 = 10 Variance = σ2 = V(X) = (1-p) / p2 = 0.9 / 0.01 = 90 Standard deviation = sqrt(99) = 9.487 Sec 3-7 Geometric & Negative Binomial Distributions
Lack of Memory Property • For a geometric random variable, the trials are independent. Thus the count of the number of trials until the next success can be started at any trial without changing the probability. • The probability that the next bit error will occur on bit 106, given that 100 bits have been transmitted, is the same as it was for bit 006. • Implies that the system does not wear out! Sec 3-7 Geometric & Negative Binomial Distributions
Example 3-23: Lack of Memory In Example 3-20, the probability that a bit is transmitted in error is 0.1. Suppose 50 bits have been transmitted. What is the mean number of bits transmitted until the next error? Answer: The mean number of bits transmitted until the next error, after 50 bits have already been transmitted, is 1 / 0.1 = 10. Sec 3-7 Geometric & Negative Binomial Distributions
Example 3-24: New Idea The probability that a bit, sent through a digital transmission channel, is received in error is 0.1. Assume that the transmissions are independent. Let X denote the number of bits transmitted until the 4th error. P(X=10) is the probability that 3 errors occur over the first 9 trials, then the 4th success occurs on the 10th trial. Sec 3-7 Geometric & Negative Binomial Distributions
Negative Binomial Definition • In a series of independent trials with constant probability of success, let the random variable X denote the number of trials until r successes occur. Then X is a negative binomial random variable with parameters 0 < p < 1 and r = 1, 2, 3, .... • The probability mass function is: • From the prior example for f(X=10|r=4): • x-1 = 9 • r-1 = 3 Sec 3-7 Geometric & Negative Binomial Distributions