Download
1 / 1
10 likes | 153 Views
Relationship of Glaucomatous Changes in Peripapillary RNFL and Macular Thickness Observed by Spectral-domain Optical Coherence Tomography Alireza Esmaeili , MD Glaucoma Fellowship. I.R.IRAN. Normal eye. Moderate Glaucoma. Severe Glaucoma. Introduction:

E N D
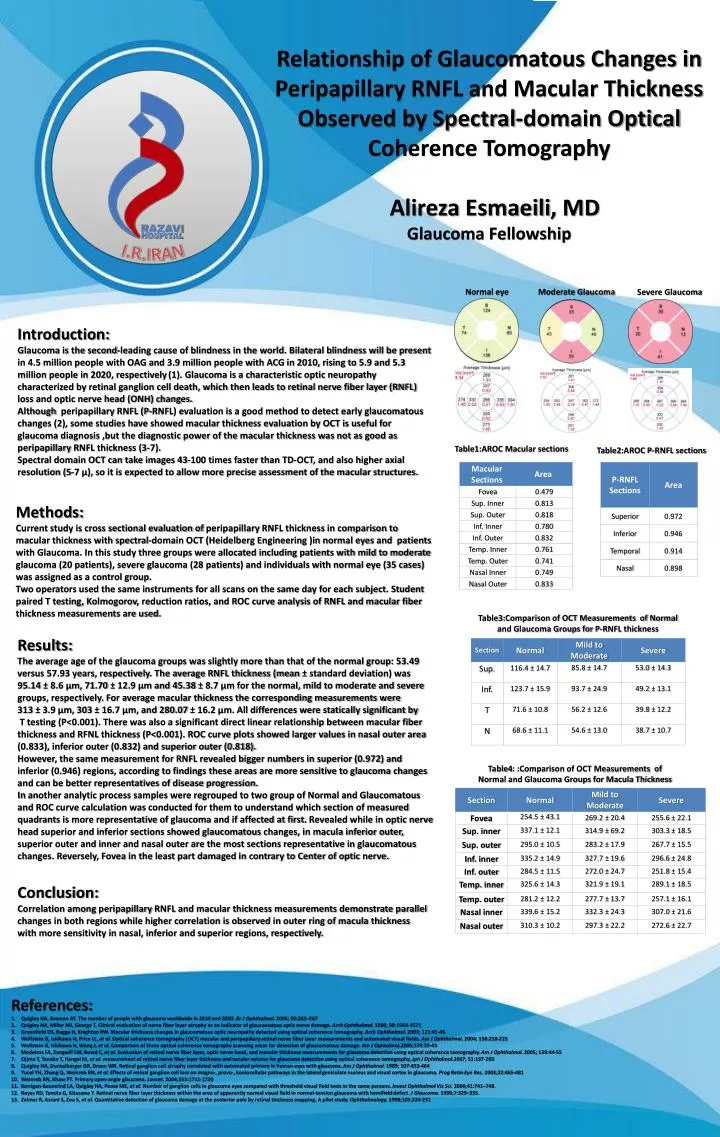
Relationship of Glaucomatous Changes in Peripapillary RNFL and Macular Thickness Observed by Spectral-domain Optical Coherence Tomography AlirezaEsmaeili, MD Glaucoma Fellowship I.R.IRAN Normal eye Moderate Glaucoma Severe Glaucoma Introduction: Glaucoma is the second-leading cause of blindness in the world. Bilateral blindness will be present in 4.5 million people with OAG and 3.9 million people with ACG in 2010, rising to 5.9 and 5.3 million people in 2020, respectively(1). Glaucoma is a characteristic optic neuropathy characterized by retinal ganglion cell death, which then leads to retinal nerve fiber layer (RNFL) loss and optic nerve head (ONH) changes. Although peripapillary RNFL (P-RNFL) evaluation is a good method to detect early glaucomatous changes (2), some studies have showed macular thickness evaluation by OCT is useful for glaucoma diagnosis ,but the diagnostic power of the macular thickness was not as good as peripapillary RNFL thickness (3-7). Spectral domain OCT can take images 43-100 times faster than TD-OCT, and also higher axial resolution (5-7 µ), so it is expected to allow more precise assessment of the macular structures. Table1:AROC Macular sections Table2:AROC P-RNFL sections Methods: Current study is cross sectional evaluation of peripapillary RNFL thickness in comparison to macular thickness with spectral-domain OCT (Heidelberg Engineering )in normal eyes and patients with Glaucoma. In this study three groups were allocated including patients with mild to moderate glaucoma (20 patients), severe glaucoma (28 patients) and individuals with normal eye (35 cases) was assigned as a control group. Two operators used the same instruments for all scans on the same day for each subject. Student paired T testing, Kolmogorov, reduction ratios, and ROC curve analysis of RNFL and macular fiber thickness measurements are used. Table3:Comparison of OCT Measurements of Normal and Glaucoma Groups for P-RNFL thickness Results: The average age of the glaucoma groups was slightly more than that of the normal group: 53.49 versus 57.93 years, respectively. The average RNFL thickness (mean ± standard deviation) was 95.14 ± 8.6 µm, 71.70 ± 12.9 µm and 45.38 ± 8.7 µm for the normal, mild to moderate and severe groups, respectively. For average macular thickness the corresponding measurements were 313 ± 3.9 µm, 303 ± 16.7 µm, and 280.07 ± 16.2 µm. All differences were statically significant by T testing (P<0.001). There was also a significant direct linear relationship between macular fiber thickness and RFNL thickness (P<0.001). ROC curve plots showed larger values in nasal outer area (0.833), inferior outer (0.832) and superior outer (0.818). However, the same measurement for RNFL revealed bigger numbers in superior (0.972) and inferior (0.946) regions, according to findings these areas are more sensitive to glaucoma changes and can be better representatives of disease progression. In another analytic process samples were regrouped to two group of Normal and Glaucomatous and ROC curve calculation was conducted for them to understand which section of measured quadrants is more representative of glaucoma and if affected at first. Revealed while in optic nerve head superior and inferior sections showed glaucomatous changes, in macula inferior outer, superior outer and inner and nasal outer are the most sections representative in glaucomatous changes. Reversely, Fovea in the least part damaged in contrary to Center of optic nerve. Table4: :Comparison of OCT Measurements of Normal and Glaucoma Groups for Macula Thickness Conclusion: Correlation among peripapillary RNFL and macular thickness measurements demonstrate parallel changes in both regions while higher correlation is observed in outer ring of macula thickness with more sensitivity in nasal, inferior and superior regions, respectively. References: Quigley HA, Broman AT. The number of people with glaucoma worldwide in 2010 and 2020. Br J Ophthalmol. 2006; 90:262–267 Quigley HA, Miller NR, George T. Clinical evaluation of nerve fiber layer atrophy as an indicator of glaucomatous optic nerve damage. Arch Ophthalmol. 1980; 98:1564-1571 Greenfield DS, Bagga H, Knighton RW. Macular thickness changes in glaucomatous optic neuropathy detected using optical coherence tomography. Arch Ophthalmol. 2003; 121:41-46 Wollstein G, Ishikawa H, Price LL, et al. Optical coherence tomography (OCT) macular and peripapillary retinal nerve fiber layer measurements and automated visual fields. Am J Ophthalmol. 2004; 138:218-225 Wollstein G, Ishikawa H, Wang J, et al. Comparison of three optical coherence tomography scanning areas for detection of glaucomatous damage. Am J Ophtalmol.2005;139:39-43 Medeiros FA, Zangwill LM, Bowd C, et al. Evaluation of retinal nerve fiber layer, optic nerve head, and macular thickness measurements for glaucoma detection using optical coherence tomography. Am J Ophthalmol. 2005; 139:44-55 Ojima T, Tanabe T, Hangai M, et al. measurement of retinal nerve fiber layer thickness and vacular volume for glaucoma detection using optical coherence tomography. Jpn J Ophthalmol.2007; 51:197-203 Quigley HA, Dunkelberger GR, Green WR. Retinal ganglion cell atrophy correlated with automated primary in human eyes with glaucoma. Am J Ophthalmol. 1989; 107:453-464 Yucel YH, Zhang Q, Weinreb RN, et al. Effects of retinal ganglion cell loss on magno-, provo-, koniocellular pathways in the lateral geniculate nucleus and visual cortex in glaucoma. ProgRetin Eye Res. 2003;22:465-481 Weinreb RN, Khaw PT. Primary open-angle glaucoma. Lancet. 2004;363:1711-1720 Kerrigan-Baumrind LA, Quigley HA, Pease ME, et al. Number of ganglion cells in glaucoma eyes compared with threshold visual field tests in the same persons. Invest Ophthalmol Vis Sci. 2000;41:741–748. Reyes RD, Tomita G, Kitazawa Y. Retinal nerve fiber layer thickness within the area of apparently normal visual field in normal-tension glaucoma with hemifield defect. J Glaucoma. 1998;7:329–335. Zeimer R, Asrani S, Zou S, et al. Quantitative detection of glaucoma damage at the posterior pole by retinal thickness mapping. A pilot study. Ophthalmology. 1998;105:224-231