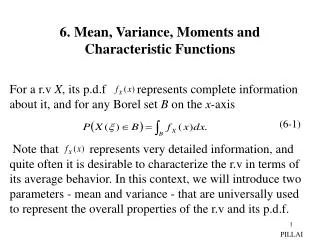
Download
1 / 61
610 likes | 807 Views
Mean and Variance. Distribution ?. statistics. pop’n dist’n. dist’n of a sample. (sample) statistic. (population) parameter. pop’n dist’n. dist’n of a sample. A new variable X from mseg of credit card data. mseg X

E N D
statistics pop’n dist’n dist’n of a sample (sample) statistic (population) parameter
pop’n dist’n dist’n of a sample
A new variable X from mseg of credit card data mseg X Low Spender 1 Med Low Spender 2 Average Spender 3 Med High Spender 4 High Spender 5
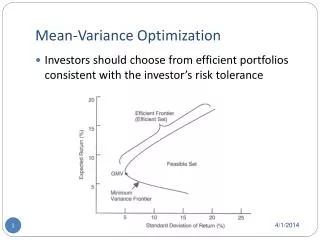
Mean, Mode Median (truncated, winsorized) Mean Measure for location (center)
50% 50% Median
1,11 2 - 9 10
6 5 6 4 Truncated mean / Winsorized mean
6 5 6 4 1 4 5 6 6 9 4 4 5 6 6 6 4 5 6 6 Truncated mean / Winsorized mean
Q Q Q 1 3 2 25% 75% 50% 50% 75% 25% 25 percentile 50 percentile 75 percentile Median Quartiles
Wrong housing statistics make wrong real estate policy. While median is better statistic than mean in representing house prices, Korean government publishes statistics calculated by mean on house prices. Mean price can be distorted by just one or two extreme prices. 일러스트=유재일 기자 jae0903@chosun.com 빗나간 주택통계 부동산 정책도 헛발질 한국의 PIR은 주택의 평균 가격과 도시근로자의 평균 가계소득을 기준으로 계산한다. 반면 미국의 PIR은 미디언 가격(MEDIAN PRICE·중간가격)과 미디언 소득을 기준으로 한다. 미디언 가격은 그 지역에서 거래된 가장 가격이 싼 주택에서부터 가장 비싼 주택을 일렬로 늘어 놓은 뒤 그 중간치를 선택한다. 건설산업전략연구소 김선덕 소장은 “평균가격이나 평균소득은 고가의 주택이나 엄청난 고소득자가 일부 포함되면 통계가 왜곡될 수 있다”고 말했다. 더군다나 한국의 주택가격은 호가(呼價)이고 미국의 주택가격은 실거래가를 기준으로 한다. 차학봉 기자 , hbcha@chosun.com입력 : 2007.03.26 23:31
p% (100-p)% p-th percentile percentile
Range InterQuartile Range (IQR) Variance Standart Deviation Measure for variability
Mean (Y) = 1*0.1 + 2*0.20 + 3*0.1 + ... + 6*0.2 = 3.8 Mean (Y) = 1*(1/6) + 2*(1/6) + ... + 6*(1/6) = 3.5
Mean of X X freq %freq Low Spender 1 26 0.26 Med Low Spender 2 20 0.20 Average Spender 3 11 0.11 Med High Spender 4 25 0.25 High Spender 5 18 0.18 ----------------------------------------------- Total 100 1.00 Mean (X) = 1*0.26 + 2*0.20 + 3*0.11 + 4*0.25 + 5*0.18 = 2.89
A new variable Q = (X – 3)2 X Q %freq Low Spender 1 (-2)2 0.26 Med Low Spender 2 (-1)2 0.20 Average Spender 3 02 0.11 Med High Spender 4 12 0.25 High Spender 5 22 0.18 ----------------------------------------------- Total 1.00 Mean (Q) = (-2)2*0.26 + (-1)2*0.20 + 02*0.11 + 12*0.25 + 22*0.18
(O) Sample variance
For large n, large enough
V = (X – 2.89 )2 X V freq Low Spender 1 (1-2.89)2 26 Med Low Spender 2 (2-2.89)2 20 Average Spender 3 (3-2.89)2 11 Med High Spender 4 (4-2.89)2 25 High Spender 5 (5-2.89)2 18 ----------------------------------------------- Total 100 Var*(X)= (1/99)[(1-2.89)2*26 + …+ (5-2.89)2*18] = 2.22 sd*(X) = 1.49
statistics pop’n dist’n dist’n of a sample sample median population median sample mean population mean sample variance population variance …. ….
no. of teeth no. of phonecalls weight of body
no. of teeth weight of body no. of phonecalls
0 1