Download
1 / 36
440 likes | 1.23k Views
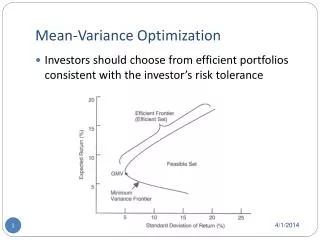
Mean-variance Criterion. Inefficient portfolios - have lower return and higher risk. Investment Opportunity Set: The n-Asset Case. An efficient portfolio is one that has the highest expected returns for a given level of risk.

E N D
Mean-variance Criterion • Inefficient portfolios- have lower return and higher risk
Investment Opportunity Set:The n-Asset Case • An efficient portfolio is one that has the highest expected returns for a given level of risk. • The efficient frontier is the frontier formed by the set of efficient portfolios. • All other portfolios, which lie outside the efficient frontier, are inefficient portfolios.
Efficient Portfolios of risky securities An efficient portfolio is one that has the highest expected returns for a given level of risk. The efficient frontier is the frontier formed by the set of efficient portfolios. All other portfolios, which lie outside the efficient frontier, are inefficient portfolios.
PORTFOLIO RISK: THE n-ASSET CASE • The calculation of risk becomes quite involved when a large number of assets or securities are combined to form a portfolio.
RISK DIVERSIFICATION:SYSTEMATIC AND UNSYSTEMATIC RISK • When more and more securities are included in a portfolio, the risk of individual securities in the portfolio is reduced. • This risk totally vanishes when the number of securities is very large. • But the risk represented by covariance remains. • Risk has two parts: • Diversifiable (unsystematic) • Non-diversifiable (systematic)
Systematic Risk • Systematic risk arises on account of the economy-wide uncertainties and the tendency of individual securities to move together with changes in the market. • This part of risk cannot be reduced through diversification. • It is also known as market risk. • Investors are exposed to market risk even when they hold well-diversified portfolios of securities.
Unsystematic Risk • Unsystematic risk arises from the unique uncertainties of individual securities. • It is also called unique risk. • These uncertainties are diversifiable if a large numbers of securities are combined to form well-diversified portfolios. • Uncertainties of individual securities in a portfolio cancel out each other. • Unsystematic risk can be totally reduced through diversification.
Rf, risk-free rate A Risk-Free Asset and A Risky Asset: Example
Borrowing and Lending Risk-return relationship for portfolio of risky and risk-free securities
MULTIPLE RISKY ASSETS ANDA RISK-FREE ASSET • In a market situation, a large number of investors holding portfolios consisting of a risk-free security and multiple risky securities participate.
Risk-return relationship for portfolio of risky and risk-free securities • We draw three lines from the risk-free rate (5%) to the three portfolios. Each line shows the manner in which capital is allocated. This line is called the capital allocation line. • Portfolio M is the optimum risky portfolio, which can be combined with the risk-free asset.
The capital market line • The capital market line (CML) is an efficient set of risk-free and risky securities, and it shows the risk-return trade-off in the market equilibrium.
Separation Theory • According to the separation theory, the choice of portfolio involves two separate steps. • The first step involves the determination of the optimum risky portfolio. • The second step concerns with the investor’s decision to form portfolio of the risk-free asset and the optimum risky portfolio depending on her risk preferences.
CAPITAL ASSET PRICING MODEL (CAPM) • The capital asset pricing model (CAPM) is a model that provides a framework to determine the required rate of return on an asset and indicates the relationship between return and risk of the asset. • The required rate of return specified by CAPM helps in valuing an asset. • One can also compare the expected (estimated) rate of return on an asset with its required rate of return and determine whether the asset is fairly valued. • Under CAPM, the security market line (SML) exemplifies the relationship between an asset’s risk and its required rate of return.
Security Market Line (SML) Security market line
Implications • Investors will always combine a risk-free asset with a market portfolio of risky assets. They will invest in risky assets in proportion to their market value. • Investors will be compensated only for that risk which they cannot diversify. • Investors can expect returns from their investment according to the risk.
Limitations • It is based on unrealistic assumptions. • It is difficult to test the validity of CAPM. • Betas do not remain stable over time.
THE ARBITRAGE PRICING THEORY (APT) • The act of taking advantage of a price differential between two or more markets is referred to as arbitrage. • The Arbitrage Pricing Theory (APT) describes the method of bring a mispriced asset in line with its expected price. • An asset is considered mispriced if its current price is different from the predicted price as per the model. • The fundamental logic of APT is that investors always indulge in arbitrage whenever they find differences in the returns of assets with similar risk characteristics.
Risk premium • Conceptually, it is the compensation, over and above, the risk-free rate of return that investors require for the risk contributed by the factor. • One could use past data on the forecasted and actual values to determine the premium.
Factor beta • The beta of the factor is the sensitivity of the asset’s return to the changes in the factor. • One can use regression approach to calculate the factor beta.