Download

1 / 9
320 likes | 1.5k Views
Mean, Variance, and Standard Deviation for Grouped Data. Section 3.3. Table 3.8 (p. 94 ). Table 3.9 (p. 95 ). Mean for Grouped Data. Find midpoint for each class ( m ). Multiply m by frequency ( f ) of that class. Mean of Population: µ = ∑ m f

E N D
Mean, Variance, and Standard Deviation for Grouped Data Section 3.3
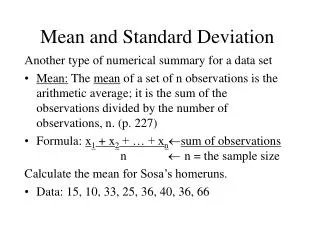
Mean for Grouped Data • Find midpoint for each class (m). • Multiply m by frequency (f) of that class. • Mean of Population: µ= ∑mf N • Mean of Sample: x = ∑mf n
Table 3.9 (p. 95) µ = 21.40 minutes
Table 3.11 (p. 96) x = 16.64 orders
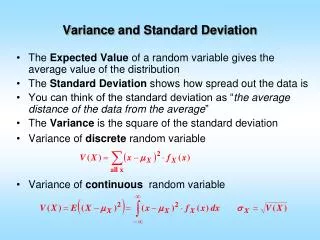
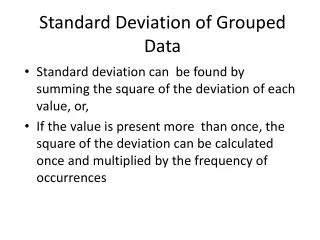
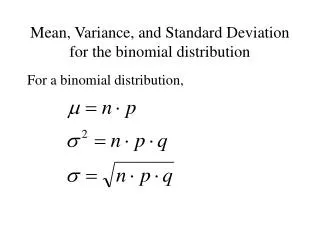
Variance and Standard Deviation for Grouped Data • Start with variance. • Population Variance: σ2= ∑f (m- µ)2 N • Sample Variance: S2 = ∑f (m- x)2 n – 1 • For Standard Deviation, take square root of Variance.
Table 3.13 (p. 98) x = 16.64 orders S2 = 7.5820 orders S = 2.75 orders