Download
1 / 78
780 likes | 794 Views
Mixed models for sensory data. Per Bruun Brockhoff Head of Statistics Section DTU Informatics http://www.imm.dtu.dk/~pbb. Outline:. Introduce DTU Informatics, Denmark. Introduce the area of sensometrics (Sensometrics Society) Give three examples of mixed modelling in sensometrics:

E N D
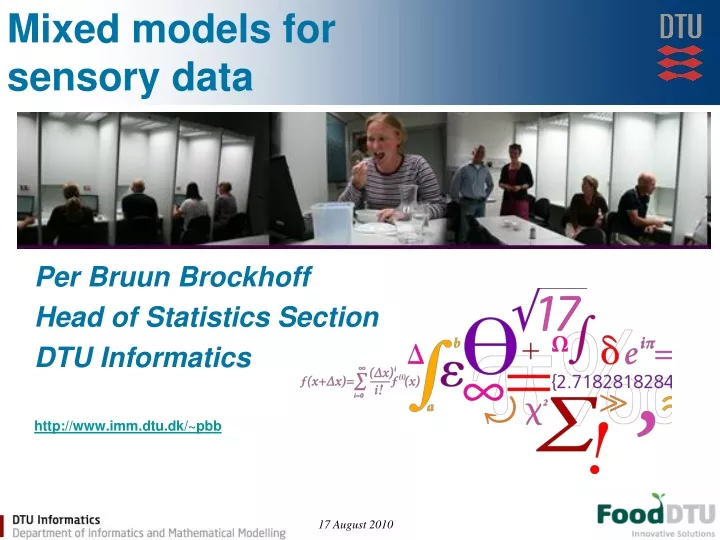
Mixed models forsensory data Per Bruun Brockhoff Head of Statistics Section DTU Informatics http://www.imm.dtu.dk/~pbb 17 August 2010
Outline: • Introduce DTU Informatics, Denmark. • Introduce the area of sensometrics(Sensometrics Society) • Give three examples of mixed modelling in sensometrics: • Panel performance and individuality • Conjoint and Preference Mapping • Discrimination and Thurstonian modelling 17 August 2010
TOP 10 Best Football Matches by Denmark EVER! • Danmark-Sovjet, 1985 • Danmark-Uruguay, 1986 • Danmark-Tyskland, 1992 • Danmark-Nigeria, 1998 • Danmark-Holland, 1992 • Danmark-Belgien, 1984 • England-Danmark, 1983 • Danmark-Brasilien, 1998 • Danmark-Ungarn, 1960 • Danmark-England, 1982 17 August 2010
TOP 10 Best Football Matches by Denmark EVER! • Danmark-Sovjet, 1985 • Danmark-Uruguay, 1986 • Danmark-Tyskland, 1992 • Danmark-Nigeria, 1998 • Danmark-Holland, 1992 • Danmark-Belgien, 1984 • England-Danmark, 1983 • Danmark-Brasilien, 1998 • Danmark-Ungarn, 1960 • Danmark-England, 1982 (2-3!!!) 17 August 2010
DTU Informatics Copenhagen, Denmark 17 August 2010
DTU Informatics Copenhagen, Denmark 17 August 2010
DTU Informatics Copenhagen, Denmark 17 August 2010
DTU Informatics Copenhagen, Denmark 17 August 2010
Statistics and Data Analysis • DTU Informatics(8 Sections) • Statistics Section (3 Ph.D.s/year in 10 years) • Image analysis Section (2-3 Ph.D.s/year in 10 years) • Cognitive Systems Section (3-4 Ph.D.s/year in 10 years) 17 August 2010
Mathematical Statistics Profile (8-10 VIP) • Dynamics • Time Series Analysis and Forecasting • Modeling of Stochastic Dynamical Systems • Stochastic Control Theory • Applied Probability with Stochastic Processes • Industrial and Applied Statistics • Statistical design and analysis of experiments • Statistical Process Control • Sensometrics and Chemometrics • Environmetrics 17 August 2010
Mathematical Statistics Profile • Characteristics: • Many externally funded projects • Many Ph.D. students • Broadly engaged outside the mathematical statistical area • Examples: • Climatology • Energy (Wind) • Pharmaceutics • Finance • Food science • Environmental research • Marine biology • Microbiology 17 August 2010
Outline: • Introduce DTU Informatics, Denmark. • Introduce the area of sensometrics(Sensometrics Society) • Give three examples of mixed modelling in sensometrics: • Panel performance and individuality • Conjoint and Preference Mapping • Discrimination and Thurstonian modelling 17 August 2010
Sensory and Sensometrics Conferences: Sensometrics (100-150) 1992 Leiden, NL 1994 Edinburgh, Scotland 1996 Nantes, France 1998 Copenhagen, Denmark 2000 Columbia, MS, USA 2002 Dortmund, Germany 2004 Davis, CA, USA 2006 Ås, Norway 2008 Ontario, Canada 2010 Rotterdam, Holland 2012 Rennes, France Pangborn Sensory (500-700-900) 1992 Järvenpää, Finland 1995 Davis, USA 1998 Ålesund, Norge 2001 Dijon, Frankrig 2003 Boston, USA 2005 Harrogate, UK 2007 Minneapolis, USA 2009 Florence, Italy 2011 Bangkok, Thailand The Sensometric Society www.sensometric.org 17 August 2010
The sensory panel: 17 August 2010
The sensory panel: 17 August 2010
This is the title 17 August 2010
Bang & Olufsen 17 August 2010
Bang & Olufsen og NASA Switch investigation • The relative importance of visual, auditory and haptic information for the user’s experience of mechanical switches • Ditte Hvas Mortensen, Department of Psychology, Aarhus University, Denmark and Bang & Olufsen a/s, Struer, Denmark • Søren Bech, Bang & Olufsen a/s, Struer, Denmark • Ranking of switches
Bang & Olufsen Bang & Olufsen 17 August 2010
What is sensometrics? Sensometricsis the scientific area that applies mathematical and statistical methods to model data from sensory and consumer science. Brockhoff, P.B. (2011). Sensometrics. In: International Encyclopedia of Statistical Science, Lovric, Miodrag (Ed.), Springer. NEW Book for NON statisticians! (to appear) 17 August 2010
Sensory/consumer data Different product/human testing procedures produce different data: • Difference/similarity testing • Triangle, duo-trio, k-AFC • Same-Different, A-not A • Descriptive Sensory Profiling (QDA) • Free Choice Profiling • Projective Mapping • Napping • Time Intensity • Time Dominant Sensation (TDS) • Consumer studies • Preference scores • Demographics, Attitudes • Etc etc 17 August 2010
Who is the (expert) analyst? S Mathematical Statistics Statistical Inference Error Modelling Mixed models C Chemometrics Machine Learning Data Mining Explorative Data Analysis P Psychophysics Psychology Cognitive science Thurstonian modelling What is good Sensometrics? 17 August 2010
Sensometrics vision C S P 17 August 2010
Outline: • Introduce DTU Informatics, Denmark. • Introduce the area of sensometrics(Sensometrics Society) • Give three examples of mixed modelling in sensometrics: • Panel performance and individuality • Conjoint and Preference Mapping • Discrimination and Thurstonian modelling 17 August 2010
Analysis of the typical sensory data set • Panelists (P)(10) • Samples (S) (8) • Session (R) (3) • Simple 3-way ANOVA for each variable: PxS PANELISTS ERROR PxR SAMPLES INTERCEPT SxR SESSIONS Main issue: Test for product differences: (as given by standard Fixed ANOVA software – NOT to be used!) 17 August 2010
Threeway ANOVA 17 August 2010
Analysis of the typical sensory data set • Problems of this test: • Does not take the “error” due to the interactions properly into account • A small average sample difference may be called significant even though there is a large,say, panelist x sample OR session x sample interaction • The result of this test cannot be generalized to panels in generalnor SESSIONS in general. • Solution: use RANDOM effects (Mixed Model) on BOTH!! 17 August 2010
Analysis of the typical sensory data set • 3-way ANOVA for each variable • Panelists AND Sessions as random effects PxS PANELISTS ERROR PxR SAMPLES INTERCEPT SxRSESSIONS Main issue: Test for sample differences: 17 August 2010
PanelCheck Visual analysis! Free open-source software developed by MATFORSK and DTU Informatics for analysis of sensory profile data and panel performance monitoring. Partners: (Main: DTU Informatics) Denmark: (Supported by DFFE) KU Life DTU Aqua Danish Meat Research Institute Chr. Hansen A/S ChewTech A/S Bang & Olufsen Norway: (Supported by Norwegian Research Council) Matforsk, Ås, Norway Tine, Gilde, Arcus AS, Hennig Olsen Is, Fiskeriforskning 17 August 2010
PanelCheck Mixed model 17 August 2010
Individual differences: Statistical models The (basic) ”assessor model”: Brockhoff & Skovgaard (1994) 17 August 2010
Difference tests, thurstonian and statistical models. Interaction = Scaling differences (Scaling variation) 17 August 2010
Analysis of Variance (fixed) 5 Products 7 Panelists (Assessors) 4 Replication 17 August 2010
The Assessor model • The data is from:Brockhoff and Skovgaard (1994): Modelling individual differences between assessors in sensory evaluations. Food Quality and Preference 5, 215-224. • Result: A ”pure scaling difference” model fitted to this data! • Random interaction model is WRONG! • Interaction = • Scaling differences + Disagreement 17 August 2010
A simple method of analysis Use the product (centered) averages as a (fixed OR random) covariate in the model: (Assessor model approximation + random interaction term) 17 August 2010
A simple method of analysis Random Scaling Fixed Scaling MS(Dis) MS(Scal) 17 August 2010
Individual Performance (and negative scalings) • Further ANOVA decomposition: ….. Pan1 Pan8 Very Significant negative scaling: Scale reversal effect 17 August 2010
Difference tests, thurstonian and statistical models. Removed Interaction = Scaling differences (Scaling variation) 17 August 2010
Individual Performance • Further ANOVA decomposition: • F-statistics: 17 August 2010
Model comparison 17 August 2010
Summary I • Mixed anova model WRONG in many cases! • Fixed scaling effect =”removal of the scaling variation” • Random scaling effect =”Scaling variation into the error”: • – Similar products: low error of difference. • – Disimilar products: have high error of diff • Simple models exist for both! 17 August 2010
Outline: • Introduce DTU Informatics, Denmark. • Introduce the area of sensometrics(Sensometrics Society) • Give three examples of mixed modelling in sensometrics: • Panel performance and individuality • Conjoint and Preference Mapping • Discrimination and Thurstonian modelling 17 August 2010
Preference mapping Sensory Profile Consumer Preferences Cons 1 ………………… Cons P Sens Attr. 1 ………. Sens Att P Prod 1 Prod 2 . . Y Prod N Prod 1 Prod 2 . . X Prod N 17 August 2010
Preference Mapping (by Latent Class Random Coefficient Regression) Pea samples Consumer segments Attributes 17 August 2010
Latent Class Random Coefficient Regression External Preference Mapping with -A statistical ‘cluster’-model for identifying the segments of consumers in the typical PrefMap-plot -A relevance criterion for selection of principal components 17 August 2010
Latent Class Random Coefficient Regression A latent class regression with -A linear/normal setting -Random consumer effect -Some principal component selection of covariates 17 August 2010
Latent Class Random Coefficient Regression A random coefficient regression with -A normal mixture distribution as random coefficient distribution -Some principal component selection of covariates 17 August 2010
ConsumerCheck Sensory Profile Consumer Preferences Cons 1 ………………… Cons P Sens Attr. 1 ………. Sens Att P Prod 1 Prod 2 . . Y Prod N Prod 1 Prod 2 . . X Prod N Product info: Treatments Instrumental data Consumer info: Demographics Attitude, behaviour 17 August 2010
ConsumerCheck Partners: (Main: DTU Informatics) Denmark: (Supported by DFFE) KU Life DTU Aqua Danish Meat Research Institute Arla Foods Technological Institute Aarhus Universitet Fertin Pharma A/S Bang & Olufsen Delta Norway: (Supported by Norwegian Research Council) Nofima Food, Ås, Norway Tine BA, Gilde, Arcus AS, Salmon Brands AS, Fjordland. International: (Supported elsewhere) Food Science Australia/CSIRO (Australian companies) Stellenbosch University, South Africa (Industrial Wine Network) Logic8 BV, The Netherlands (Provider of Eyequestion Software) 17 August 2010