Download
1 / 29
290 likes | 484 Views
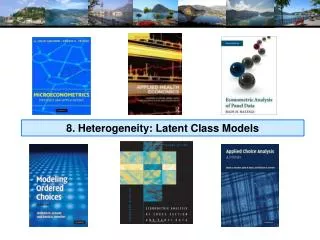
9. Heterogeneity: Mixed Models. RANDOM Parameter Models. A Recast Random Effects Model. A Computable Log Likelihood. Simulation. Random Effects Model: Simulation. ---------------------------------------------------------------------- Random Coefficients Probit Model

E N D
Random Effects Model: Simulation ---------------------------------------------------------------------- Random Coefficients Probit Model Dependent variable DOCTOR (Quadrature Based) Log likelihood function -16296.68110 (-16290.72192) Restricted log likelihood -17701.08500 Chi squared [ 1 d.f.] 2808.80780 Simulation based on 50 Halton draws --------+------------------------------------------------- Variable| Coefficient Standard Error b/St.Er. P[|Z|>z] --------+------------------------------------------------- |Nonrandom parameters AGE| .02226*** .00081 27.365 .0000 ( .02232) EDUC| -.03285*** .00391 -8.407 .0000 (-.03307) HHNINC| .00673 .05105 .132 .8952 ( .00660) |Means for random parameters Constant| -.11873** .05950 -1.995 .0460 (-.11819) |Scale parameters for dists. of random parameters Constant| .90453*** .01128 80.180 .0000 --------+------------------------------------------------------------- Implied from these estimates is .904542/(1+.904532) = .449998.
S M
A Hierarchical Probit Model Uit = 1i + 2iAgeit + 3iEducit + 4iIncomeit + it. 1i=1+11 Femalei + 12 Marriedi + u1i 2i=2+21 Femalei + 22 Marriedi + u2i 3i=3+31 Femalei + 32 Marriedi + u3i 4i=4+41 Femalei + 42 Marriedi + u4i Yit = 1[Uit > 0] All random variables normally distributed.
Simulating Conditional Means for Individual Parameters Posterior estimates of E[parameters(i) | Data(i)]
Mixed Model Estimation Programs differ on the models fitted, the algorithms, the paradigm, and the extensions provided to the simplest RPM, i = +wi. • WinBUGS: • MCMC • User specifies the model – constructs the Gibbs Sampler/Metropolis Hastings • MLWin: • Linear and some nonlinear – logit, Poisson, etc. • Uses MCMC for MLE (noninformative priors) • SAS: Proc Mixed. • Classical • Uses primarily a kind of GLS/GMM (method of moments algorithm for loglinear models) • Stata: Classical • Several loglinear models – GLAMM. Mixing done by quadrature. • Maximum simulated likelihood for multinomial choice (Arne Hole, user provided) • LIMDEP/NLOGIT • Classical • Mixing done by Monte Carlo integration – maximum simulated likelihood • Numerous linear, nonlinear, loglinear models • Ken Train’s Gauss Code • Monte Carlo integration • Mixed Logit (mixed multinomial logit) model only (but free!) • Biogeme • Multinomial choice models • Many experimental models (developer’s hobby)
Quasi-Monte Carlo Integration Based on Halton Sequences For example, using base p=5, the integer r=37 has b0 = 2, b1 = 2, and b2= 1; (37=1x52 + 2x51 + 2x50). Then H(37|5) = 25-1 + 25-2 + 15-3 = 0.448.
Halton Sequences vs. Random Draws Requires far fewer draws – for one dimension, about 1/10. Accelerates estimation by a factor of 5 to 10.