Download
1 / 38
380 likes | 385 Views
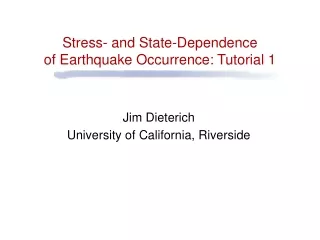
This tutorial explains the stress and state dependence of earthquake occurrence, including the effect of stress change on nucleation time and the evolution of slip speeds. It also covers earthquake rate formulation, Coulomb stress, and factors affecting aftershock decay. The tutorial provides useful solutions and methods for analyzing earthquake rates and obtaining stress time series from earthquake data.

E N D
Stress- and State-Dependence of Earthquake Occurrence: Tutorial 2 Jim Dieterich University of California, Riverside
Constant V (high) x V1 B mss Coefficient of friction m B-A Constant V (low) Log q
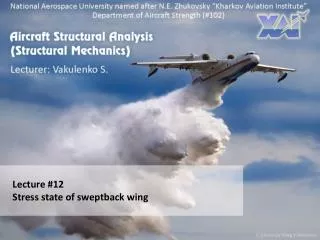
During slip evolves toward ss Constant V (high) x V1 B mss Coefficient of friction m B-A Constant V (low) Log q
During slip evolves toward ss Constant V (high) x V1 B mss Coefficient of friction m B-A Constant V (low) Log q
During slip evolves toward ss Constant V (high) x V1 B mss Coefficient of friction m B-A Constant V (low) Log q
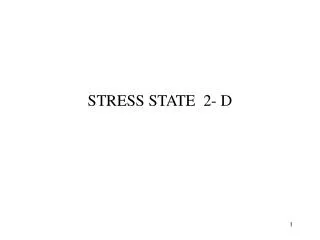
6 4 2 0 -2 -4 -6 -8 -10 -12 -14 -16 10-2 10-1 100 101 102 103 104 105 106 107 108 109 1010 1011 Effect of stress change on nucleation time Log (slip speed) m/s 1 yr 10 yr 20 yr Time to instability (seconds)
6 4 2 0 -2 -4 -6 -8 -10 -12 -14 -16 10-2 10-1 100 101 102 103 104 105 106 107 108 109 1010 1011 Effect of stress change on nucleation time = 11.6 5min ~1hr Log (slip speed) m/s ~5hr 1 yr 10 yr 20 yr Time to instability (seconds)
Earthquake rate formulation: Model • Earthquake occurrence is represented as a sequence of earthquake nucleation events. • Dependence of nucleation times on stressing history is given by nucleation solutions derived for rate- and state-dependent fault strength. • Model assumes 1) The population of nucleation sources is spontaneously renewed as stress increases 2) Reference steady-state seismicity rate r at the constant stressing rate .
Log (slip speed) Log (time to instability) Model for earthquake occurrence • Use the solution for time to nucleation an earthquake • (1) , where • and assume steady-state seismicity rate r at the stressing rate • This defines the distribution of initial conditions • (slip speeds) for the nucleation sources • (2) • The distribution of slip speeds (2) can be updated at successive time steps for any stressing history, using solutions for change of slip speed as a function of time and stress. , n is the sequence number of the earthquake source
Evolution of distribution of slip speeds For example changes of with time are given by the nucleation solutions and change of with stress are given directly from the rate- and state- formulation In all cases, the final distribution has the form of the original distribution where
Evolution of distribution of slip speeds Earthquake rate is found by taking the derivative dn/dt = R For any stressing history
Coulomb stress formulation for earthquake rates Earthquake rate , Coulomb stress Assume small stress changes (treat as constants) , Note: . Hence, Earthquake rate , Dieterich, Cayol, Okubo, Nature, (2000), Dieterich and others, US Geological Survey Professional Paper - 1676 (2003)
Some useful solutions Earthquake rate Evolution with time Stress step
(steady state) S t Example
t=0 S t Example - Secondary aftershocks
Earthquake rates following a stress step Earthquake rate (R/r ) Time (t/ta )
Aftershocks by time and distance Time at which x is at edge of aftershock zone
Factors affecting rate of aftershock decay (p) • In this model, intrinsic value p=1 • The following factors result in p≠1 • Spatial heterogeneity of stress change (S/A) p < 1 • Stress relaxation by log(t) after the stress step • if u>0.2 p > 1 • Secondary aftershocks p > 1 (short-term effect)
Earthquake rate (R/r0) Time (t/ta) Net aftershock rate for region surroundinga circular shear rupture Slope p=0.8
Triggering by seismic waves Over short time intervals (Dt <<ta)
Triggering by seismic waves r = 5.0x10⁻⁵ /s Cumulative Number Stress (S/A) Time (seconds)
Triggering by seismic waves Peak stress S/A 10.15 10.14 9.00
Triggering by seismic waves Peak amplitude (S) to trigger EQ (A) 10 year Time to EQ with no triggering (sec)
x Triggering by seismic waves Peak amplitude (S) to trigger EQ (A) Threshold stress model 10 year Time to EQ with no triggering (sec)
Change of earthquakes rates, tidal stresses Over short time intervals (Dt <<ta) For small stress changes (DS << As) this becomes
Minimum number of events to see tidal influence DS = S75-100 - S0-25 DS~ 0.01 - 0.02 bar As = 1 bar: DR/r = 0.01 - 0.02 As = 2 bar: DR/r = 0.005 - 0.01
Method to obtain stress time series from earthquake rates STEPS 1) Select region and magnitude threshold 2) Obtain time series for g : 4) Solve evolution equation for Coulomb stress S. For example:
Maps of stress changes from earthquake rates STEPS 1) From earthquake rates obtain time series for gat regular grid points: 2) Solve evolution equation for Coulomb stress S as a function of time at each grid point 3) Prepare maps (or cross sections) of stress changes over specified time intervals Dieterich, Cayol, and Okubo, Nature (2000) Dieterich and others, USGS Prof Paper(2004)
Foreshock models Model A Foreshocks Advance the time of Mainshock Mainshocks following foreshocks and aftershocks have similar origins. The stress change of a prior earthquake results in increased nucleation rates at all magnitudes. Extrapolation of aftershock rates to larger magnitudes gives rate of foreshocks DS is a function of distance from the prior earthquake. Net earthquake rate following a stress step is obtained by integrating over the region affected by the stress change.
Foreshock models Model B Mainshock Nucleation Causes Foreshocks Premonitory creep of a large nucleation zone causes rapid stressing on nearby smaller nucleation sources
Foreshock model B Nucleation on fractal fault 2 hours before instability