Download
1 / 7
100 likes | 275 Views
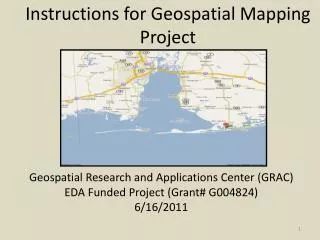
Mapping Toolbox Access, visualize, and analyze geospatial data. March, 2013 Ariel Rubanenko Application, Consulting & Tool Implementation for Large-scale simulations, Guidance, Navigation & Control. Geospatial data access Access Web Map Services(WMS) Manipulation of map data

E N D
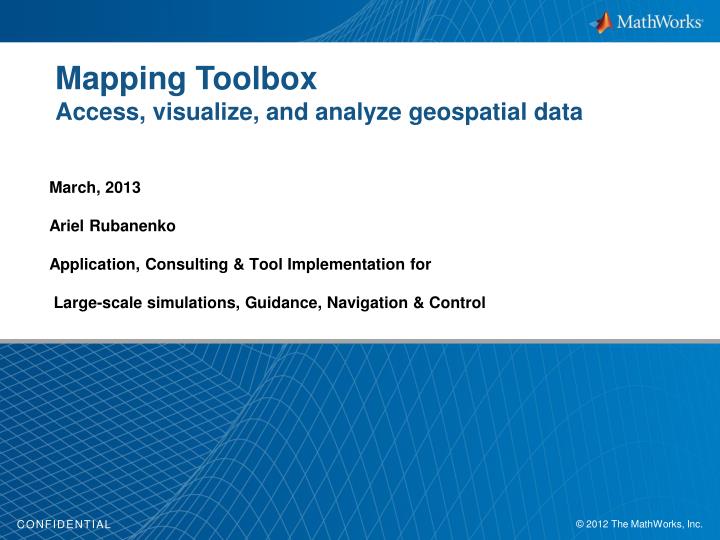
Mapping ToolboxAccess, visualize, and analyze geospatial data March, 2013 Ariel Rubanenko Application, Consulting & Tool Implementation for Large-scale simulations, Guidance, Navigation & Control
Geospatial data access Access Web Map Services(WMS) Manipulation of map data 2-D and 3-D map displays Analysis functions Mapping Toolbox Key Features
Vector maps ESRI shapefiles, VMAP0, DCW, TIGER, GSHHS Georeferenced imagery GeoTIFF TIFF/JPEG/PNG with world files NITF Gridded terrain and bathymetry Arc Grid ASCII, USGS DEM, NIMA DTED, GTOPO30, SDTSraster profile, Smith and Sandwell grid and more Geospatial Data Access
find and download raster data from WMS servers NASA, ESA, USGS, NOAA, ESRI Access Web Map Services(WMS) Collapse of the Larsen Ice Shelf, Antarctica, over a 3-month period. Original coastline segmented using Image Processing Toolbox. Images courtesy of NASA/Goddard Space Flight Center Scientific Visualization Studio. A composite map of San Francisco created with functions in Mapping Toolbox. Data courtesy of U.S. Geological Survey and retrieved via Microsoft TerraServer
2-D and 3-D Map Displays mapview, mapshow, geoshow
Distance calculations Area calculations Data unit conversions Geographic statistics Navigation calculations Terrain analysis Geospatial Computation and Analysis
Problem Detect changes using recent unregistered aerial photograph and registered orthophoto Solution Select control points to infer and apply geometric transform Display both images in map coordinates Image Registration